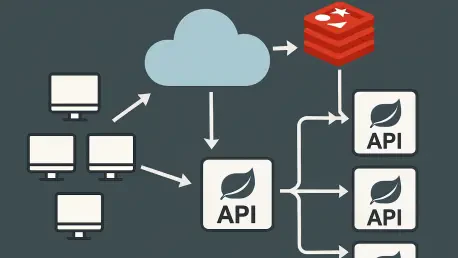

In the high-stakes world of enterprise SaaS, the difference between a seamless user experience and a total system failure often comes down to how efficiently a backend can handle a sudden surge in traffic. Vijay Raina has spent years at the forefront of this battle, specializing in software architecture and the intricate dance of data between application layers and persistent storage. As a recognized thought leader in software design, Vijay understands that building for scale isn’t just about adding more servers, but about optimizing the flow of information to eliminate bottlenecks before they occur. In this discussion, we explore the nuances of high-performance API design, focusing on how sophisticated caching strategies and rigorous load testing can transform a struggling system into a high-throughput powerhouse.
The conversation covers the fundamental shift from traditional database latencies to the near-instantaneous speeds of in-memory storage, the practical implementation of cache management within the Spring Boot ecosystem, and the strategic trade-offs required to maintain data consistency. We also delve into advanced protective measures like distributed locking to prevent system-wide collapses during traffic spikes and the methodologies used to validate these optimizations under realistic pressure.
Traditional databases often measure response times in milliseconds, while Redis can complete operations in microseconds. How do you quantify the impact of this performance gap on overall API throughput, and can you share a specific scenario where caching dramatically reduced an expensive request’s response time?
The shift from milliseconds to microseconds is more than just a numerical improvement; it represents a fundamental change in how we design user experiences. When a database call takes hundreds of milliseconds, even a perfectly optimized SQL query can become a liability if it is called thousands of times per second. By moving that data into memory, we are effectively removing the physical constraints of disk I/O and network overhead inherent in traditional RDBMS environments. I recall a specific instance where a particularly heavy request, burdened by complex joins and large data sets, was taking over 10 seconds to complete on a cold start. By implementing a strategic Redis layer, we were able to slash that response time to under 1 second for all subsequent hits. This level of optimization doesn’t just make things faster; it increases the overall throughput of the API by an order of magnitude because the application threads are no longer sitting idle waiting for the database to return a result.
When configuring a RedisCacheManager in a Spring Boot environment, what are the essential setup steps for a production-ready system? Specifically, how do you handle Time-To-Live (TTL) settings and eviction annotations like @CacheEvict to ensure data stays fresh without slowing down the application?
To get a Spring Boot application production-ready, the first step is integrating the necessary dependencies like spring-boot-starter-cache and the Redis connector into your Maven configuration. You must then explicitly enable the caching layer using the @EnableCaching annotation on your configuration class, which allows Spring to auto-configure the RedisCacheManager. For a robust setup, it is crucial to define sensible default Time-To-Live values in your application properties to prevent the memory from filling up with stale data. I always emphasize using @CacheEvict alongside delete operations because it ensures that “ghost entries” are purged from the cache the moment the source of truth is updated. This proactive invalidation prevents the application from serving outdated information, which is a common pitfall when developers rely solely on TTL for data freshness.
Choosing between write-through and write-behind caching involves significant trade-offs regarding data consistency and database pressure. Under what specific architectural conditions would you favor one over the other, and what manual steps are necessary to ensure the cache remains synchronized during a standard update or delete operation?
The choice between these patterns usually hinges on how much risk the business is willing to take regarding immediate data consistency. I favor the write-through approach in most enterprise scenarios because it synchronously updates both the database and the cache, ensuring the two are always in lockstep. This can be achieved in Spring by using @CachePut on your save methods, which forces the cache to refresh with the newly persisted data immediately. In contrast, write-behind caching is excellent for high-volume write scenarios where reducing database pressure is the top priority, though it introduces a window of potential data loss if the system fails before the batch write completes. Regardless of the choice, you must manually ensure that any delete or update operation triggers an eviction or an update to the specific cache key to keep the system synchronized and prevent users from seeing stale records.
High-volume traffic can trigger a cache stampede when a hot item expires, potentially overwhelming the underlying database. How do you implement distributed locking using tools like Redisson to serialize these cache misses, and what are the specific performance costs associated with this type of synchronization?
A cache stampede, or the “thundering herd” problem, occurs when hundreds of concurrent requests all realize a popular cache key has expired and simultaneously hammer the database to fetch the same data. To solve this in a distributed environment, we use Redisson to implement a lock that ensures only one thread is allowed to perform the expensive database query while the others wait patiently. For example, you might set a tryLock with a 5-second timeout, which serializes the process so that the first thread populates the cache and the subsequent threads simply read the newly cached value. While this does introduce a slight latency penalty for those waiting threads, the cost is negligible compared to the alternative of a database crash caused by a surge of redundant queries. It is a protective measure that preserves the stability of the entire infrastructure during peak traffic periods.
Load testing is vital for verifying caching efficiency under realistic pressure. Using a tool like JMeter, how do you structure a test plan to measure the transition from cold misses to warm hits, and what specific metrics should engineers monitor to confirm the API’s maximum throughput?
When structuring a JMeter test plan, I typically start by configuring a Thread Group of 100 concurrent users to simulate a realistic high-load environment. The test should run for a sustained period, such as 60 seconds, to allow us to observe the transition from “cold misses,” where the system is hitting the database, to “warm hits,” where Redis is doing the heavy lifting. Engineers need to keep a close eye on metrics like average response time, error rates, and total throughput to see exactly where the breaking point lies. In our tests, we often see latencies drop from 10 seconds down to under 1 second once the cache is fully primed, which is the clearest indicator of success. Monitoring the cache hit rate via Spring Boot Actuator or Redis tools during these runs provides the granular data needed to confirm that the API is hitting its maximum theoretical throughput without overtaxing the database.
What is your forecast for high-volume API optimization?
I believe we are moving toward a future where caching becomes even more intelligent and autonomous, moving away from manual TTL configurations toward machine-learning-driven eviction policies. We will likely see a tighter integration between edge computing and centralized caches, where the system predicts which data will be “hot” before the first request even arrives. As APIs handle increasingly massive global datasets, the focus will shift from simple key-value storage to more complex in-memory processing and real-time data streaming. Ultimately, the goal will be to eliminate the concept of a “cold miss” entirely, ensuring that the database remains a background archive while the memory layer handles the entirety of the active workload.