
Navigating the relentless flood of updates across thousands of open-source repositories has transformed from a casual developer habit into a critical operational challenge for modern engineering teams. The GitHub Repository Monitor emerges as a sophisticated response to this information overload, shifting the burden of vigilance from the human eye to a persistent, localized agent. This technology does not merely poll for changes; it creates a structured historical record, allowing developers to maintain a consistent pulse on fast-moving ecosystems without the cognitive fatigue associated with manual tracking. By integrating core principles of autonomous execution and lightweight state management, the tool represents a bridge between simple automation and the more complex agentic workflows currently defining the high-end software development landscape.
Evolution of Autonomous Developer Tools
The transition from manual monitoring to agent-based automation marks a fundamental shift in how developers interact with the global code commons. In the early stages of open-source collaboration, staying updated required active participation in mailing lists or the constant refreshing of browser tabs. While RSS feeds provided a temporary solution, they lacked the granular control and historical persistence needed for professional auditing. The GitHub Repository Monitor evolves this concept by moving the logic from a “pull” model, where the user initiates the check, to an “autonomous” model, where the system operates independently within the local environment. This shift is essential in an era where frameworks such as Docling or the watsonx Agent Development Kit can undergo multiple significant changes in a single afternoon.
The relevance of such a tool in the broader technological landscape cannot be overstated, particularly as engineering teams move toward decentralized, local-first environments. While centralized services offer notification systems, they often lack the customization and privacy afforded by a local tool. By delegating the repetitive task of repository tracking to a functional agent, developers can reclaim valuable time for creative problem-solving. This technology emerged as part of a broader movement to industrialize developer productivity, recognizing that even minor friction—like checking a timestamp on a website—accumulates into significant waste over the course of a fiscal year.
Technical Architecture and Core Components
Python-Driven Logic and Delta Detection
At the heart of the system lies a robust logic engine written in Python, chosen for its extensive library support and readability. This engine utilizes a persistent request session to communicate with the GitHub REST API, which is far more efficient than making individual, isolated calls. By maintaining a persistent connection, the application reduces the overhead associated with the TCP handshake process, ensuring that even large watchlists are processed with minimal latency. The primary mechanism for change detection involves comparing the “pushed_at” timestamp from the remote repository against the “last_checked” value stored in the local database. This delta detection logic is the cornerstone of the agent’s intelligence, allowing it to ignore noise and focus exclusively on meaningful activity.
The implementation of this logic also includes sophisticated error handling and rate-limit management. When the agent encounters a restrictive API ceiling, it can gracefully degrade its performance or utilize environment-stored personal access tokens to elevate its permissions. This ensures that the monitoring remains uninterrupted even when tracking high-traffic repositories. Moreover, the logic is designed to be forviging; it parses repository lists from plain text files, automatically stripping comments and whitespace to prevent runtime exceptions. This architectural choice prioritizes user experience by allowing the watchlist to be managed through a simple text editor rather than requiring complex database interactions.
Persistent State Management with SQLite
While the logic engine handles the “how” of monitoring, the SQLite backend provides the “where” and “when.” Unlike many modern applications that rely on heavy, external database servers, this monitor utilizes a serverless, local-first approach. SQLite stores the entire application state in a single, cross-platform file, which simplifies backups and ensures that the history of repository activity remains private to the user’s machine. The database schema is carefully normalized, featuring a repository registry and a historical updates ledger. This relational structure allows for complex queries, such as calculating the frequency of updates over a specific period or identifying which projects are currently the most active in a developer’s portfolio.
The use of indexing is what separates this tool from a basic logging script. By creating indexes on frequently queried fields like repository names and timestamps, the system ensures that performance remains constant regardless of the volume of data collected. As a watchlist grows from a dozen repositories to several hundred, the time required to check if a repository exists or to log a new update remains negligible. This persistent state management also allows the agent to survive system restarts or network outages; once connectivity is restored, the agent can immediately identify what it missed by comparing the current API state with its last recorded historical entry.
System Integration and Automated Scheduling
The true agency of the monitor is realized through its integration with the host operating system. Using Bash scripts as a thin orchestration layer, the application bridges the gap between the Python logic and the system’s native task schedulers. On macOS, this often involves the use of launchd, which manages scheduled tasks through XML-based property list files. This method is superior to traditional scheduling because it can resume missed tasks if the computer was asleep during the scheduled run time. By wrapping the execution in a Bash script, the developer ensures that the environment is correctly configured with the necessary paths and permissions before the Python script even begins its work.
Furthermore, the integration handles the mundane but necessary task of maintenance. The orchestration script includes a garbage collection routine that identifies and purges old logs, preventing the local storage from being cluttered by thousands of historical text files. This level of system-level awareness is critical for an agent that is intended to run “headless” and unattended. The script also handles security hurdles, such as navigating the Full Disk Access requirements of modern macOS versions. By explicitly routing logs and output into dedicated directories, the system maintains a clean audit trail that can be inspected by the developer at any time without disrupting the automated cycle.
Flask-Based Visual Dashboard
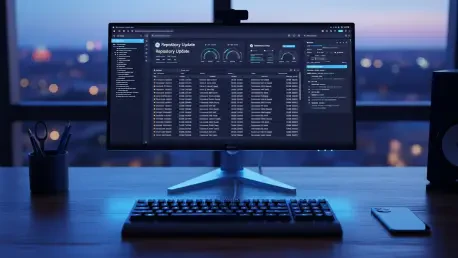
While the backend operates in the shadows, the Flask-based web viewer provides the necessary transparency for the developer. This dashboard translates raw, binary database records into a clean, actionable interface. The primary value of this visual layer is the reduction of friction; rather than querying a database to see what has changed, a developer can simply open a local URL to see a prioritized list of updates. The UI is designed to be a command center, featuring direct links to the relevant GitHub pages. This means that once an update is detected, the transition from notification to code review is a single-click process, significantly streamlining the maintenance phase of the software lifecycle.
The dashboard also provides high-level statistics that offer insights into the developer’s own interests and the health of their dependencies. By visualizing the timeline of updates, the user can identify trends—such as a surge in activity in a particular framework—that might indicate a major release or a critical security patch. The use of Flask ensures that this interface is lightweight and responsive, running only when the developer needs it. This separation of concerns between the headless monitoring agent and the on-demand visual dashboard reflects a mature architectural philosophy that prioritizes system efficiency over flashy, resource-intensive interfaces.
Innovations in Agentic Workflow Development
The development of the GitHub Repository Monitor highlights a broader trend in software engineering: the rise of agentic workflow development. Unlike traditional coding, where a human manually writes every line of logic, this project was accelerated through the use of AI-driven development partners like IBM Bob. This innovation allows for the rapid prototyping of production-ready tools by shifting the developer’s role from a “writer” to an “architect.” The AI partner handles the boilerplate of database initialization and API integration, while the human developer focuses on the high-level logic and system integration. This collaboration compressed what would traditionally be a multi-day project into a single session, demonstrating the efficiency gains possible when human expertise is augmented by specialized AI.
These agentic workflows are particularly unique because they result in tools that are themselves agents. The outcome is a self-reinforcing cycle of productivity: an agent is used to build an agent that then automates a recurring task. This shift suggests a future where developers spend less time on the “how” of building and more time on the “what.” The ability of an AI partner to generate resilient, indexed SQL schemas and complex Bash scripts for system-level scheduling means that sophisticated, industrial-grade tools are now within the reach of individual engineers. This democratization of high-performance tool building is perhaps the most significant innovation to emerge from this implementation.
Practical Applications and Industrial Use Cases
In a professional setting, the ability to track fast-moving AI frameworks is a matter of competitive advantage. For companies relying on cutting-edge technologies like the watsonx platform, being even a few days behind on a repository update can lead to integration failures or missed feature opportunities. The GitHub Repository Monitor provides a formalized way to manage this risk. Beyond simple notification, it creates a historical audit trail that can be used for compliance. For example, if a team needs to prove when they first integrated a specific version of an open-source library, the monitor’s persistent database provides an immutable record of discovery and update, which is invaluable for enterprise-level reporting and security audits.
Another critical application is found in the management of internal, enterprise-level repositories. In large organizations with thousands of developers, keeping track of changes across internal shared libraries can be as difficult as monitoring the public internet. By pointing the monitor at private GitHub Enterprise instances, teams can create localized dashboards that alert them to changes in internal APIs before those changes break their builds. This proactive approach to dependency management reduces the “maintenance tax” that often slows down large engineering teams. The tool’s lightweight nature makes it easy to deploy across various internal environments, providing a uniform way to monitor both public and private intellectual property.
Challenges and Technical Hurdles
Despite its efficiency, the technology faces several hurdles, most notably the constraints imposed by external APIs. GitHub enforces strict rate limits on unauthenticated requests to prevent server abuse. While the implementation of personal access tokens mitigates this, it introduces a layer of credential management that can be a barrier for some users. Furthermore, as a watchlist grows, the cumulative time taken to query each repository sequentially increases. While this is currently manageable for a few hundred repositories, a truly industrial-scale monitoring effort might eventually require the implementation of asynchronous processing or multi-threading to maintain a responsive execution window.
Another challenge involves the increasing security posture of modern operating systems. macOS, in particular, has introduced stringent privacy controls that can cause background scripts like cron or launchd to fail if they lack explicit Full Disk Access. This requires the user to manually intervene in the system settings, a step that breaks the “it just works” philosophy of simple automation. Additionally, managing the growth of local storage remains a concern. While logs are purged, the SQLite database itself will grow indefinitely as more updates are recorded. Long-term users will eventually need to implement archival policies to move older data into compressed storage, ensuring that the primary database remains lean and fast.
Future Outlook and Strategic Trajectory
The trajectory of localized monitoring agents is heading toward deeper integration with Large Language Models (LLMs) to perform semantic analysis of changes. Rather than just reporting that a “pushed_at” timestamp has changed, the next generation of this technology will likely utilize LLMs to summarize the actual code diffs. This would allow the agent to inform the developer not just that something changed, but why it matters—distinguishing between a minor documentation fix and a major API-breaking change. This evolution from timestamp monitoring to semantic understanding will further reduce the noise that developers must filter through daily.
Furthermore, we are moving toward a world of decentralized, autonomous developer agents that communicate with one another. A local repository monitor could, in theory, trigger a local CI/CD pipeline the moment a critical update is detected, testing the new code against the developer’s current project before they even wake up. This localized, proactive ecosystem would represent the ultimate realization of the agentic workflow. As the cost of running small, specialized models locally continues to drop, the barrier to adding this level of intelligence to a simple Python tool will vanish, leading to a more efficient and resilient development culture.
Final Assessment and Summary
The GitHub Repository Monitor demonstrated a successful transition from manual, high-friction developer habits to a streamlined, automated workflow. By combining the flexibility of Python with the reliability of SQLite and the native power of system-level scheduling, the tool provided a clear example of how individual productivity can be scaled through localized agency. The implementation showcased that modern development is no longer just about writing code; it was about orchestrating systems that manage information on the developer’s behalf. This shift effectively eliminated the cognitive load of monitoring hundreds of repositories, allowing for a more focused and intentional approach to software maintenance and open-source contribution.
The project also proved that the integration of AI-driven development partners significantly accelerated the creation of production-ready infrastructure. The ability to build such a robust system in a short timeframe highlighted a new era of engineering where the “maintenance tax” could be minimized through strategic automation. While challenges such as API rate limits and operating system security remained, the overall impact on developer efficiency was profound. Moving forward, the lessons learned from this monitor suggested that the future of engineering lay in localized, intelligent agents that not only observed the world but also interpreted it, providing developers with the precise information needed to stay ahead in an increasingly rapid technological landscape.