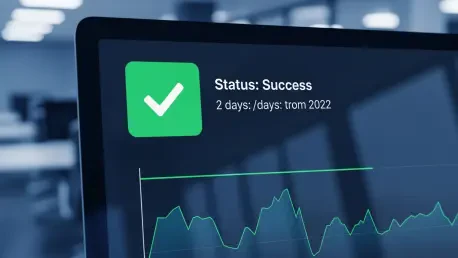

A flawlessly synchronized data pipeline often presents a deceptive sense of security when every automated validation report arrives with a perfect green status despite the underlying information being dangerously outdated. This paradox represents one of the most significant hurdles for modern data platforms, where the technical definition of success often conflicts with the business definition of utility. While software engineers celebrate a job that completes without errors, business analysts are left wondering why their reports show no new sales for the past several hours. The resulting disconnect creates a friction point that can quickly erode the trust built between technical departments and the stakeholders they serve.
The reliance on structural integrity as a proxy for total quality is a dangerous oversight that leaves organizations vulnerable to silent failures. These occur when the plumbing works perfectly, but the water in the pipes is stagnant. Without a specific focus on temporal relevance, data quality programs remain incomplete, monitoring the container while ignoring the expiration date of the contents. In an environment where decision speeds are accelerating, the distance between the real world and its digital representation must be measured with the same rigor as schema accuracy or null-value counts. Identifying why these gaps persist requires a shift in how quality is defined and managed across the entire lifecycle of a record.
The High Cost of the Silent Green Checkmark
A data pipeline completes successfully, every schema validation returns a pass, and the monitoring dashboard glows a reassuring green, yet the business is making decisions based on data that stopped updating forty-eight hours ago. This phenomenon is a quiet failure that undermines trust in data platforms because it happens while every standard quality check reports perfection. When validity is treated as a proxy for freshness, organizations unknowingly serve well-formed lies to their stakeholders. The psychological impact of a green checkmark is powerful; it signals to a user that the information is safe to consume, yet when that information fails to reflect recent reality, the credibility of the entire engineering team is called into question.
The financial and operational consequences of acting on obsolete data can be severe, especially in sectors where market conditions change by the minute. For instance, an inventory management system might show a healthy stock of a popular item because the ingestion job successfully processed the previous day’s files, failing to account for a morning surge in sales that went unrecorded. The dashboard remains green because the data it holds is technically perfect, but the business reality has shifted. This discrepancy creates a blind spot where leadership makes commitments based on a version of the world that no longer exists, leading to missed opportunities or costly logistical errors.
Furthermore, the persistent nature of these silent failures tends to breed a culture of skepticism among data consumers. Once a stakeholder identifies that the “healthy” dashboard is actually displaying yesterday’s truths, they begin to manually verify every data point, effectively duplicating effort and bypassing the automated systems designed to support them. This loss of confidence is often harder to repair than a technical bug. A data platform that reports success while delivering stale information is, in many ways, more dangerous than one that simply fails, as the latter at least signals that something is wrong.
Why Traditional Quality Metrics Fail to Measure Time
Most data quality programs are designed to answer whether data is structurally sound, checking for null values, correct data types, and referential integrity. While these checks are essential for identifying corrupted or malformed records, they possess a significant blind spot: a record can be perfectly valid while being completely obsolete. Freshness is an independent property of quality that describes the data relative to the present moment, yet it is frequently excluded from quality models in favor of simpler operational metrics. If a table expects a string and receives a string, the quality check passes, regardless of whether that string represents a customer address from today or five years ago.
Traditional metrics focus primarily on the “what” and “how” of data rather than the “when.” Dimensions such as completeness and accuracy are often measured in a vacuum, isolated from the timeline of the business processes they represent. For example, a dataset might be 100 percent complete in terms of having no missing values, but if those values were supposed to be updated hourly and have not changed in a week, the completeness metric provides a false sense of health. The static nature of these checks means they are incapable of detecting the gradual degradation of relevance that occurs as time passes.
Consequently, there is a fundamental mismatch between the tools used to monitor data and the needs of those who use it. Engineers often focus on the integrity of the data at rest, while the business is concerned with the velocity of data in motion. Bridging this gap requires an admission that structural validity is a necessary but insufficient condition for quality. Until time is integrated as a core dimension of the quality framework, the monitoring systems will continue to report perfection on data that has already expired.
How Successful Pipelines Mask Invisible Data Staleness
Staleness remains hidden because technical teams often mistake pipeline success for data currency. Several common scenarios allow a pipeline to report a successful run without actually delivering new information. One frequent culprit is the source system failing to provide new files, which leads the ingestion job to re-process old data without error. Since the job finds the file it expects in the directory it expects, it executes the transformation logic perfectly and signals a successful completion. To the monitoring system, this looks like a normal run, even though no new events have reached the destination table.
Partial data arrivals present another significant challenge where only specific partitions land, leaving the overall dataset incomplete but technically valid. A pipeline might be configured to load data from ten different regions, but if a network glitch prevents two regions from delivering their files, the job might still finish successfully for the other eight. Because the records that did arrive pass all validation tests, the pipeline glows green. The missing data is not flagged as an error because the system was never taught to expect a specific volume or a specific set of source markers to constitute a “complete” run.
Additionally, caching layers in Business Intelligence tools and late-arriving upstream data can create further layers of invisibility. A scheduled job might process an old snapshot of a source because the upstream provider was delayed by just a few minutes. Alternatively, the pipeline may update the underlying database perfectly, but a caching mechanism in the reporting layer continues to serve outdated results to the end-users. In both cases, the technical metrics show a successful execution, while the actual value delivered to the decision-maker remains frozen in the past.
Quantifying the Freshness Gap Through the Four Pillars of Time
Reliable freshness monitoring requires distinguishing between different timestamps to measure the freshness gap, which is the duration between a real-world event and its availability to the consumer. Expert data practitioners track four distinct points in time to gain full visibility into the lifecycle of a record. The first is event time, marking when the action actually occurred in the source system. The second is ingestion time, the moment the record entered the data platform. The third is processing time, when the data was cleaned and transformed. Finally, publish time is when the record became queryable by the end-user.
The true measure of quality is the distance between event time and publish time, as this represents the total delay reality faces before it reaches a decision-maker. Monitoring only the processing time is a common mistake that leads to false confidence. A pipeline might have a processing time of only five minutes, suggesting high efficiency, while the ingestion time shows that the data sat in a queue for six hours before the job even started. By isolating each of these four pillars, teams can identify exactly where the friction exists in the delivery chain and whether the delay is an upstream problem or an internal bottleneck.
Moreover, understanding these pillars allows for a more nuanced conversation about data latency. It moves the discussion away from vague complaints about data being “slow” and toward specific metrics that can be optimized. If the gap between ingestion and processing is high, it suggests a need for better scheduling or more frequent job runs. If the gap between event time and ingestion is high, the focus shifts toward the source systems and the methods used to capture data. This granular approach ensures that the “freshness gap” is not just observed but actively managed as a key performance indicator.
A Practical Framework for Implementing Freshness Contracts
To ensure data remains actionable, organizations must transition from job-based monitoring to dataset-specific freshness contracts. This practical approach involves defining specific freshness SLAs based on business urgency, such as five-minute thresholds for fraud detection versus twenty-four hours for archives. Each dataset should have a clear agreement that defines what “fresh” means for that specific context. This prevents a one-size-fits-all approach that either over-engineers simple tables or under-serves critical real-time requirements.
Implementing these contracts requires persisting event timestamps through every stage of the pipeline to prevent the loss of metadata. Without the original event time, it is impossible to calculate the freshness gap once the data reaches the final table. Organizations should maintain an audit table that records the maximum event time and publish time for every successful run. This metadata acts as a ledger of currency, allowing monitoring tools to alert when the duration of the freshness gap exceeds the predefined SLA, regardless of whether the software job itself finished without an exit code error.
Finally, transparency is the most effective tool for rebuilding stakeholder trust. Surfacing the last updated status directly to end-users on dashboards allows them to assess the risk of acting on the data provided. When a user can see that the data was last updated ten minutes ago, they proceed with confidence; when they see it was updated two days ago, they can adjust their strategy accordingly. This proactive communication ensures that even when delays occur, the “silent” failure is eliminated, and the business remains aware of the limitations of its current view.
The shift toward time-aware data modeling provided the necessary clarity for organizations that had previously struggled with the invisible degradation of their datasets. Engineering teams adopted automated audit trails that recorded the exact delay between an event and its availability, ensuring that transparency became the default state of the platform. By establishing rigorous freshness contracts, the disconnect between technical success and business utility was resolved, ultimately rebuilding the trust that had been compromised by silent pipeline failures. This transition ensured that the green checkmark finally represented a complete and timely truth, rather than just a successful execution of code.