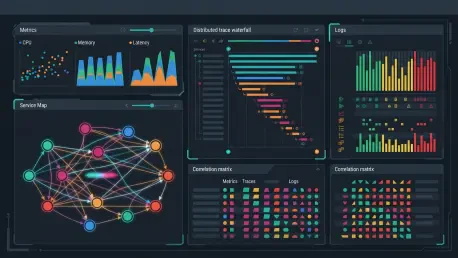

The emergence of ephemeral containers has dramatically increased the volume of unique dimensions that traditional monitoring tools were never designed to handle. For many years, the industry relied on the “Wall of Charts,” a centralized dashboard filled with visual graphs tracking basic metrics like CPU usage and request latency. This model functioned adequately for monolithic applications where failures were generally predictable and localized. However, as software architectures transitioned toward microservices and highly distributed workloads, these static displays began to lose their utility. Modern infrastructure is now far too fluid for a fixed grid of charts to capture effectively, marking a critical shift from mere monitoring to deep system understanding. The fundamental limitation of traditional visibility lies in its focus on symptoms rather than causes. A dashboard can easily show that a system is failing by highlighting a spike in error rates, but it rarely explains the underlying reason in an immediate way.
The Structural Failures: Contextual and Aggregate Issues
The Challenge: Contextual Chasms and Silos
One of the primary obstacles in legacy monitoring is the contextual chasm, where metrics, logs, and traces are siloed in separate tools. When an incident occurs, engineers are often forced to act as data archaeologists, manually correlating a timestamp on a metric graph with a specific entry in a log file across different browser tabs. This fragmented approach creates a massive delay in identifying the actual source of a problem because these data streams do not naturally communicate with one another. Consequently, the human operator becomes the bottleneck, struggling to piece together a coherent narrative from isolated data points while the system remains in a degraded state. In 2026, the complexity of inter-service communication means that even a minor delay in correlation can lead to significant financial losses. This manual synchronization is no longer sustainable for teams managing microservices where every second of downtime carries a high cost.
The Decline: Aggregation and Anticipation Bias
Furthermore, traditional systems often rely on pre-aggregation to manage storage costs, which effectively destroys fine-grained detail. By averaging data points over time, these tools erase the outliers and long-tail anomalies that represent the most complex bugs in a production environment. This leads to an anticipation bias, where dashboards only provide answers to questions that engineers thought to ask during the initial design phase. If a failure mode is novel or unexpected—as is common in distributed systems—the existing charts offer no insight, leaving the team blind to unknown-unknown issues. To combat this, modern platforms avoid destructive aggregation, ensuring that the unique characteristics of every request are preserved. This shift allows for an exploratory approach to debugging, where engineers can pivot between different dimensions of data without losing the specific context of an individual transaction, making the resolution process more precise.
Engineering the Shift: High-Cardinality and Unified Layers
Unified DatExploratory Analytics Tools
To address these shortcomings, the industry has embraced high-cardinality unified data layers. Unlike older systems that discard specific dimensions to save space, modern observability platforms retain raw, unaggregated event streams. By preserving details such as Trace IDs, customer identifiers, and specific container headers, engineers can filter through billions of events to pinpoint the exact thread responsible for a failure. This granular approach transforms telemetry from a static display into a powerful exploratory analytics tool. In 2026, the ability to query across high-cardinality data has become the baseline for operational excellence. Organizations now prioritize the ability to slice and dice data in real-time, allowing them to identify patterns that would be invisible in a standard metric-based monitoring system. This transition represents a move away from reactive firefighting and toward a proactive understanding of system behavior that accommodates the unpredictable nature of cloud-native environments.
Contextual Topology: Causal Mapping and AI
This evolution also introduces contextual topology, which maps the complex relationships between various services. Instead of receiving dozens of isolated alerts for a single incident, engineers can view a unified incident narrative that shows how a minor configuration change in one service triggered a cascade of failures downstream. This move toward causality is being further accelerated by agentic AI, which can consume these telemetry streams in real-time. These autonomous agents can execute preventative actions, such as scaling clusters or rolling back deployments, often before a human is even alerted. By integrating causal mapping with automated remediation, teams can reduce their mean time to resolution from hours to minutes. This level of automation is essential for maintaining service level agreements in an environment where the number of microservices exceeds the cognitive capacity of any single operator, ensuring that the infrastructure remains resilient and self-healing.
Monitoring the Future: Semantic Integrity and AI Health
Beyond Status Codes: Tracking Semantic Health
The rise of Large Language Models and generative software has introduced a new layer of complexity that traditional monitoring cannot handle. In the past, a service was considered healthy if it returned a successful HTTP status code. However, an AI-driven service can be technically up while providing incorrect or hallucinated information to the end-user. This shift requires a move toward semantic monitoring, where the focus is on the quality of the output rather than just the availability of the server. Observability in this new era involves tracking non-deterministic factors like prompt guardrails, vector pipeline drift, and semantic tokens. These elements represent the health of the logic rather than just the health of the hardware. Because an AI’s behavior can change based on the data it processes, engineers must use high-cardinality tracking to observe how specific inputs affect model performance. This ensures that the system remains reliable even when the infrastructure behaves in a non-linear fashion.
The Solution: Intelligent Sampling and Tiered Storage
A sustainable framework for modern observability eventually relied on intelligent data sampling and tiered storage horizons. Rather than storing every successful request, Site Reliability Engineering teams successfully utilized tail-based sampling to preserve the critical signal needed for troubleshooting. This approach ensured that one hundred percent of the data for errors or high-latency events was kept, while only a small fraction of routine requests was archived. The integration of hot, warm, and cold storage tiers allowed for high-performance querying where it mattered most, while significantly reducing long-term costs. Moving forward, the most effective strategy involved automating the lifecycle of telemetry data and purging high-cardinality dimensions as they aged. By treating observability as a data engineering problem rather than a simple visual display, organizations managed to navigate the complexity of cloud-native infrastructure with both technical precision and fiscal responsibility.