
I’m thrilled to sit down with Vijay Raina, a seasoned expert in enterprise SaaS technology and software design, who has made significant strides in the realm of real-time telemetry analytics. With a deep background in architecture and thought leadership, Vijay spearheaded a transformative project at TELUS to develop a nationwide telemetry analytics platform. Using cutting-edge tools like Google Cloud Platform and Apache Airflow, his work has redefined how operational data drives decision-making and customer experience. In this conversation, we’ll explore the challenges of modernizing outdated data systems, the innovative solutions his team implemented, and the profound impact of real-time insights on business operations.
Can you start by giving us an overview of the telemetry analytics platform you developed at TELUS, and what drove the need for such a system?
Absolutely. At TELUS, we set out to build a real-time telemetry analytics platform to handle data from over 100,000 set-top boxes across Canada. The primary driver was the need to empower our teams with timely, actionable insights to improve operational decisions and enhance customer experiences. Our legacy systems just couldn’t keep up with the scale or speed required, so we needed a modern, scalable solution to process massive volumes of data and deliver near-instant results.
What were some of the major hurdles you faced with the old data infrastructure before this overhaul?
The old setup was a patchwork of batch-oriented pipelines that were slow and disjointed. We dealt with significant delays in data processing, limited visibility into device health, and a complete lack of real-time diagnostics. This meant we couldn’t correlate device telemetry with customer issues quickly enough, which often left us reacting to problems rather than preventing them. It was a bottleneck that affected everything from customer support to network reliability.
Can you share a specific incident that underscored the urgency for this transformation?
One incident that stands out is a major regional outage we experienced. Because our data was batch-processed, we couldn’t identify affected devices in real time. All the analysis had to be done after the fact, which delayed our response and frustrated both our teams and customers. That event was a wake-up call—it made it crystal clear that we needed a platform capable of real-time monitoring and predictive insights to prevent such issues from escalating.
Why did you choose Google Cloud Platform as the foundation for this new telemetry solution?
We chose GCP because of its robust scalability and suite of tools tailored for big data analytics. It offered seamless integration for real-time data processing, which was critical for our goals. Components like BigQuery allowed us to handle both structured and semi-structured data efficiently, while Cloud Storage provided a reliable staging area for raw data. GCP’s flexibility and performance made it the ideal backbone for managing telemetry at a national scale.
How did Apache Airflow play a role in managing the complex workflows of this platform?
Apache Airflow was instrumental in orchestrating our data pipelines. Its ability to define modular DAGs—directed acyclic graphs—let us control every stage of the ETL process with precision. We could break down complex tasks into manageable pieces, schedule them based on time or events, and ensure dependencies were handled smoothly. Airflow’s flexibility allowed us to optimize workflows without disrupting upstream or downstream systems, which was a game-changer for operational efficiency.
Can you elaborate on how Infrastructure-as-Code tools contributed to the project’s success?
Tools like Pulumi and Terraform were key to automating our infrastructure provisioning across development, testing, and production environments. By codifying our setups, we eliminated manual errors and ensured consistency. We also kept configurations YAML-driven and version-controlled, which made onboarding new team members easier and enabled quick rollbacks if something went wrong. This approach saved us countless hours and prevented configuration drift, keeping our environments stable.
What kind of impact did the platform have once it was up and running?
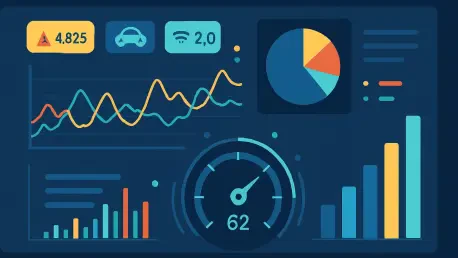
The impact was immediate and measurable. Within the first month, customer support escalations related to set-top box issues dropped by about 25% thanks to proactive alerts. We achieved over 98% accuracy in data transformations with rigorous validations, and our dashboards displayed real-time insights with less than five minutes of latency. Processing over 10 terabytes of data daily became routine, and for the first time, our operations teams could monitor live device health and anticipate outages before they impacted customers.
How did empowering end-users with tools like dashboards change the way teams operated?
It was transformative. We built centralized dashboards using Looker, powered by BigQuery views, which allowed operations teams to search telemetry data by serial number, firmware version, or region. This self-service access to previously siloed data meant they could respond to incidents faster and make informed decisions without waiting for reports. Seeing the network reliability team’s reaction to their first live dashboard—saying they’d never had such visibility before—was incredibly rewarding and validated all our hard work.
What’s your forecast for the future of real-time telemetry analytics in large-scale operations like this?
I believe real-time telemetry analytics will become the standard for any large-scale operation, especially as IoT and connected devices continue to grow. The ability to process and act on data instantly isn’t just a competitive advantage—it’s a necessity. I expect we’ll see even tighter integration of AI and machine learning to predict issues before they occur, alongside more accessible tools for non-technical users to leverage data. Cloud platforms will keep evolving to handle bigger datasets with lower latency, making solutions like ours more ubiquitous across industries.


