
A silent failure in a high-traffic microservice is the modern engineer’s recurring nightmare, often lurking undetected until customer support lines light up with complaints. In the fast-paced world of software deployment, an application running without telemetry is effectively a black box where developers can see it exists but remain blind to its internal health. Relying on reactive debugging—waiting for a system to crash before investigating—is a high-stakes gamble that often results in prolonged downtime and lost revenue. Monitoring provides the essential “eyes” for digital infrastructure, converting raw execution logs into a narrative that reveals memory leaks, CPU spikes, or surging error rates long before they spiral into systemic outages.
Operational intelligence is no longer a luxury reserved for tech giants; it is the baseline for any resilient Spring Boot application. To bridge the gap between static code and a living, breathing production environment, developers rely on a powerful trifectSpring Boot Actuator, Prometheus, and Grafana. This combination serves as a specialized sensory system, a high-speed database, and a visual command center. By implementing this stack, teams move away from guesswork and toward a data-driven culture where every millisecond of latency and every byte of heap memory is accounted for in real time.
The High Stakes of Application Blindness
Operating a complex backend ecosystem without visibility is akin to flying a plane through a storm without an altimeter. While Spring Boot has dramatically simplified the developer experience, it also abstracts away many complexities that can fail in subtle ways. Without a dedicated monitoring strategy, a minor memory leak might take days to manifest as an “Out of Memory” error, leaving the DevOps team scrambling to find the root cause in a sea of logs. High-performance monitoring transforms these invisible risks into measurable metrics, allowing for a proactive stance toward system stability.
In a production environment, the cost of being “blind” to application performance extends beyond technical debt to the user experience. Latency spikes that go unnoticed can lead to high bounce rates and customer frustration, even if the application technically remains “up.” Telemetry allows engineers to spot these trends early, identifying bottlenecks in database queries or external API calls. This visibility ensures that the infrastructure can scale gracefully under pressure, maintaining a consistent level of service regardless of traffic fluctuations.
Bridging the Gap: Code and Operational Intelligence
Spring Boot Actuator and Micrometer function as the internal nervous system of the application, collecting vital data points from the Java Virtual Machine and HTTP traffic. Micrometer acts as a neutral instrumentation library, often described as the “SLF4J for metrics,” which allows developers to write code once and export data to various monitoring systems. When the Prometheus registry is integrated, it automatically translates internal Spring metrics into a format that a time-series database can digest, creating a seamless bridge between the application’s logic and its operational status.
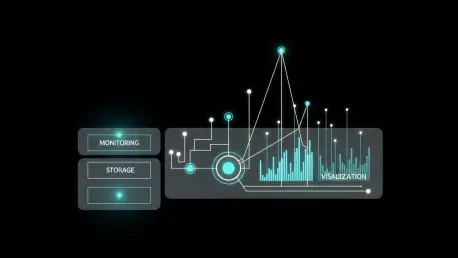
Prometheus and Grafana complete this ecosystem by providing the storage and visualization layers necessary for large-scale analysis. Prometheus operates on a pull-based architecture, meaning it regularly “scrapes” the application for updates rather than waiting for the application to push data out. This design protects the application from being overwhelmed by its own telemetry during high-load scenarios. Grafana then connects to Prometheus, pulling these complex query results and translating them into intuitive, real-time dashboards that provide an at-a-glance view of the entire system’s health.
Technical Architecture: From Micrometer to Dashboards
The workflow of a modern monitoring pipeline is a masterclass in decoupled design. It begins with the application exposing a dedicated /actuator/prometheus endpoint, which presents a list of current metrics in a text-based format. This endpoint acts as a snapshot of the application’s current state, including thread counts, garbage collection statistics, and custom business counters. Because this data is exposed over standard HTTP, it becomes easily accessible to any authorized scraper within the internal network.
Once the data is ingested into Prometheus, it is stored as time-series data, which allows for sophisticated querying over various durations. This architecture is intentionally minimalist to ensure maximum reliability; the monitoring server controls the frequency of data collection, preventing a “thundering herd” effect on the application. Finally, Grafana serves as the window into this data, allowing engineers to build panels that track everything from successful checkouts per minute to the distribution of request latencies across different service instances.
Wisdom From the Trenches: Naming and Performance
Experienced engineers emphasize that the quality of a monitoring setup is determined by the clarity of its metrics. A common trap for beginners is the “cardinality explosion,” which occurs when too many unique labels—such as specific User IDs or session tokens—are attached to a single metric. This causes the database to grow exponentially, slowing down queries and consuming excessive memory. To maintain a healthy system, it is vital to use concise labels and follow naming conventions like snake_case, ensuring that units like seconds or bytes are always included in the metric name.
Security is another critical pillar that cannot be overlooked when exposing internal metrics. Management endpoints, while useful, contain sensitive information about the application’s environment and should never be reachable from the public internet. Best practices dictate that these endpoints should be restricted to a private management network or strictly guarded by Spring Security. By isolating the telemetry traffic from public user traffic, organizations can maintain high visibility without increasing their attack surface.
A Practical Implementation Roadmap: Production Monitoring
Transitioning to a fully monitored environment requires a structured approach that starts with the project configuration. By adding the spring-boot-starter-actuator and micrometer-registry-prometheus dependencies to the build file, the application is immediately equipped with its metrics engine. The next step involves updating the application.properties file to explicitly expose the Prometheus endpoint, ensuring that only necessary information is shared while sensitive internal beans remain hidden from the scraper.
Once the application is ready, the focus shifts to the monitoring infrastructure itself. This involves setting up a prometheus.yml configuration file with a scrape job that targets the application’s specific host and port. Establishing a scrape interval of 15 to 30 seconds strikes a balance between data granularity and system overhead. Finally, connecting Grafana as a consumer of the Prometheus data allows teams to import community-standard dashboards, such as the “Spring Boot Statistics” template, providing immediate professional-grade visibility without the need for manual panel creation.
The implementation of a robust monitoring stack transformed the way development teams approached application reliability. By shifting from a reactive “fix-on-failure” mindset to a proactive stance, engineers gained the ability to predict outages before they occurred. The integration of Prometheus and Grafana provided a centralized source of truth that unified developers and operations teams under a single data-driven narrative. As systems grew in complexity, the investment in clean metric naming and strict security protocols ensured that the monitoring infrastructure remained both scalable and secure. Ultimately, the move toward comprehensive telemetry proved to be the most effective way to maintain high availability in an increasingly demanding digital landscape.