
Dependency resolution faults, such as a single misspelled package name in a package.json file, can now be automatically correlated with specific GitHub commits via EventBridge and Lambda. This level of automation marks a significant departure from the manual log-diving that traditionally consumed hours of a developer’s day. As CI/CD environments become increasingly complex, the ability to pinpoint exactly which line of code or configuration change triggered a pipeline failure is no longer a luxury but a necessity for maintaining rapid deployment cycles. Modern engineering teams often face a deluge of data from failed builds, where error messages are obscured by nested dependencies or transient network issues. By leveraging an intelligent agent within the AWS ecosystem, organizations can bridge the gap between their version control systems and cloud-based build servers. This shift allows for a more proactive approach to software reliability, ensuring that delivery pipelines remain fluid and that engineering talent is focused on innovation rather than repetitive troubleshooting tasks in 2026.
1: Establishing Access and Initializing the Agent Workspace
Before deploying the automated diagnostic tools, the initial phase requires a meticulous setup of access and permissions to ensure cross-service security. This involves configuring an AWS account with the specific rights necessary to generate IAM roles for the designated Agent Space, which serves as the central hub for all investigative activities. In scenarios where an enterprise manages its cloud resources across multiple secondary source accounts, engineers must establish specialized roles that allow the agent to assume permissions across account boundaries safely. On the GitHub side of the integration, administrative access at the repository or organizational level is mandatory to authorize the agent’s interaction with the codebase. This foundational layer ensures that the system can read commit histories and repository metadata without compromising the overall security posture of the development environment. Establishing these rigorous security protocols at the outset prevents unauthorized access while providing the agent with the visibility it needs to function correctly.
Once the permissions are in place, the next logical progression involves the initialization of the Agent Workspace, a dedicated environment tailored to a specific application’s monitoring needs. Each Agent Space should be named according to the application it serves, creating a logical separation of concerns within the broader AWS infrastructure. During this setup process, the system automatically generates two essential IAM roles that govern how the agent interacts with other AWS services and external repositories. It is a best practice to update these roles with clear, descriptive names immediately after their creation to maintain an organized and searchable infrastructure catalog. Proper naming conventions prevent confusion during audits or when scaling the system to include dozens of different applications across various production environments. This structured approach to workspace organization ensures that the diagnostic findings remain isolated to the relevant project, facilitating faster identification of issues without the noise of unrelated pipeline data.
2: Integrating Repositories and Configuring Automated Triggers
Securing the communication channel between GitHub and AWS is the critical next step in the implementation process, achieved through the generation of a unique webhook. Within the Capabilities section of the agent interface, a webhook is created to act as the primary listener for repository events, such as code pushes or pull request updates. To protect these sensitive credentials, the AWS CLI is utilized to store the webhook secret securely within AWS Secrets Manager, ensuring that authentication tokens are never exposed in plain text. Following the security configuration, the specific GitHub repositories must be registered through the agent’s user interface to establish a formal link. This process initiates a synchronization phase where the repository status transitions from a “Ready to connect” state to “Connected” once the handshake is verified. This persistent connection is what allows the agent to monitor code changes in real-time and correlate them with any subsequent failures observed in the AWS CodePipeline environment.
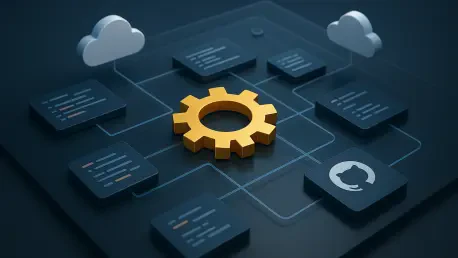
With the link established, the focus shifts to configuring the active monitoring and trigger mechanisms that alert the agent to potential issues. Amazon CloudWatch must be activated on the target application to capture granular performance data and system logs that serve as the raw material for diagnostic analysis. A Lambda function, often referred to as the WebHook Executor, is then implemented alongside an EventBridge rule to create an automated response system. This architecture ensures that whenever a pipeline stage fails or a predefined CloudWatch alarm is triggered, the system automatically sends an authenticated request to the DevOps Agent to initiate an investigation. This eliminates the need for manual intervention when a build breaks, as the system is programmed to react instantaneously to negative signals. By automating the trigger mechanism, teams ensure that the root cause analysis begins the moment a problem occurs, significantly reducing the mean time to recovery for critical production services and development workflows.
3: Analyzing Diagnostic Results and Managing Resource Lifecycles
The actual value of the automation is realized when reviewing the diagnostic findings and mitigation plans generated after a failure event. Engineers can access the Incident Response tab within the Agent Space web application to view a comprehensive breakdown of the results. The agent performs a deep dive into logs, such as CodeBuild outputs and deployment logs, and intelligently correlates them with the recent commit history to identify the specific change that introduced the error. Whether the issue is an infrastructure mismatch, a dependency error, or a logic flaw in the latest code push, the agent provides a clear audit trail and remediation guidance. This allows the team to verify the agent’s logic before applying a fix, ensuring that the resolution is both accurate and effective. This data-driven approach to incident management provides a level of clarity that was previously difficult to achieve, transforming the way developers interact with their logs and version control data during a crisis.
Managing the lifecycle of these automated tools was essential for maintaining a cost-effective cloud environment, especially since the service operated on a pay-per-use model. Once the diagnostic phase completed or the project requirements changed, decommissioning the associated resources became a standard procedure to prevent unnecessary billing. This process involved wiping the webhook secret from AWS Secrets Manager and deactivating the specific Agent Space to halt all monitoring activities. Furthermore, severing the GitHub pipeline link and removing the associated IAM roles, Lambda functions, and CloudWatch alarms ensured that no residual components remained active. Engineering teams that implemented these lifecycle management strategies found that they could maintain high levels of operational efficiency without incurring excessive infrastructure overhead. Looking ahead, the integration of generative insights into these agents will likely refine the precision of remediation steps even further. These steps provided a sustainable path for scaling automated diagnostics across entire software portfolios.