
Vijay Raina is a distinguished expert in enterprise SaaS technology and software architecture, with a deep specialization in managing complex IT infrastructures. Having weathered the storms of catastrophic system failures and overseen the digital transformation of major network ecosystems, he brings a unique blend of technical mastery and strategic foresight to the table. In this conversation, Vijay shares the hard-won lessons from a high-stakes network crash and explains how shifting from a reactive “firefighting” mode to a data-driven visibility strategy can safeguard an organization’s most critical assets.
When a critical network crash occurs in the middle of the night without clear indicators, what are the first diagnostic steps an administrator should take? How do these steps change when transitioning from a reactive “firefighting” mindset to a data-driven strategy centered on visibility?
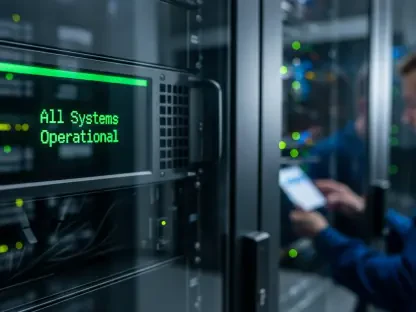
In the heat of a 2:17 AM crisis, the immediate instinct is to start checking individual hardware like routers and firewalls, but without visibility, you are essentially flying blind. The first step should be identifying the point of failure by looking at performance metrics like CPU usage and latency across all nodes, rather than just guessing which device is acting up. Transitioning to a data-driven strategy means you stop being a “firefighter” who responds to alarms and start being a strategist who uses real-time monitoring to see a bandwidth spike before it cascades. By the time we implemented a proper system, we moved from hours of panicked searching to having a 24/7 security system that tracks every endpoint automatically. This shift allows us to catch a single failing endpoint before it results in a total data center blackout, saving both the company’s reputation and the team’s sanity.
How do specific protocols like SNMP, ICMP, and NetFlow work together to provide a holistic view of network health? When analyzing CPU usage and latency, what specific performance metrics are most critical for identifying a bandwidth spike before it triggers a system-wide failure?
These protocols are the building blocks of a transparent infrastructure, where SNMP and ICMP help track the uptime and health of devices while NetFlow provides the deep dive into traffic patterns. We use these tools to gather millions of data points, focusing specifically on response times and packet loss to ensure the “pipes” aren’t getting clogged. When we look at bandwidth, we are specifically hunting for any connection hitting that dangerous 95% capacity threshold during peak hours, which is often a ticking time bomb for a crash. By integrating these metrics, we can see exactly which endpoints are consuming the most resources and when, allowing us to adjust before a bottleneck turns into a system-wide failure. It’s about moving beyond just knowing if a device is “on” to understanding exactly how much stress it is under at any given second.
Beyond just listing devices, how does real-time topology mapping help trace problems through a complex interconnected ecosystem? In what ways does visualizing the relationship between routers, firewalls, and IoT devices reduce the time spent on root cause analysis during an outage?
A simple list of devices tells you nothing about the “why” behind a failure, whereas a real-time topology map reveals the entire interconnected ecosystem of servers, SaaS applications, and IoT devices. When an issue occurs, visualization allows us to see the ripple effect; for instance, how a surge in a Cisco router might be starving a web server of data. This map turns a manual, hours-long investigation into a process that takes mere minutes because we can see status indicators on every device simultaneously. It allows the team to understand the relationships between components, identifying the root cause at the source rather than just treating the symptoms downstream. Having that bird’s-eye view transformed our network from a collection of isolated hardware into a cohesive, manageable organism.
Establishing a “normal” behavior baseline is vital for stability, but how do you determine where to set intelligent notification thresholds? What is the process for using these baselines to detect security threats or unauthorized access that might otherwise fly under the radar?
Determining “normal” requires consistent tracking over time to understand typical traffic rhythms, such as knowing what your bandwidth looks like at 3 PM versus 3 AM. We set our intelligent thresholds just above these established baselines, so the moment a deviation occurs—like an unusual data flow—an automated notification is sent to the team. This is a powerful security tool because many cybersecurity threats or unauthorized access attempts look like minor fluctuations that would fly under the radar of manual checks. By monitoring for anomalous behavior that breaks the established pattern, we can intercept potential breaches before they escalate into full-scale data thefts. It essentially creates an early warning system that protects the network from both technical glitches and malicious actors.
When a connection consistently hits peak capacity, what data points are most useful for long-term capacity planning and resource allocation? How can IT teams use automated software to shift their focus from manual checks to high-level infrastructure optimization and future workload forecasting?
The most useful data points for long-term planning are historical traffic patterns and the frequency of capacity spikes, which show us exactly when we need to scale our infrastructure. Instead of having staff manually log in to check dozens of devices every day, automated software performs these checks every few seconds, freeing up our experts for high-level optimization. We use this data to forecast future workloads, ensuring we allocate resources to the most strained parts of the network before they reach a breaking point. This proactive approach allowed us to identify bottlenecks we never even knew existed, turning our IT department into a proactive arm of the business rather than a reactive one. By leveraging automation, we ensure that our growth is supported by a stable, scalable foundation that can handle millions of data points without breaking a sweat.
Do you have any advice for our readers?
My biggest piece of advice is to never wait for a disaster to prove the value of visibility; prevention is always the best cure for network health. You should treat your network as a living ecosystem where every component is connected, and your goal should be to understand those connections through data rather than guesswork. Invest in automated tools that provide real-time status indicators and topology mapping so you can see problems coming from a mile away. If you can establish clear baselines and intelligent thresholds today, you won’t just be saving your network—you’ll be reclaiming your time and ensuring your business can scale without the fear of a 2 AM phone call. Monitoring is not just an IT task; it is the fundamental insurance policy for your entire digital operation.