
Engineering teams in 2026 can pinpoint a microservice latency spike to the exact millisecond, yet they often remain completely blind to the financial disaster occurring beneath the surface of their high-performance architecture. While SREs and developers obsess over p99 metrics and error rates, a silent failure occurs when a performance-optimized update causes a cloud bill to balloon by thousands of dollars overnight. This guide provides a blueprint for integrating cost as a first-class telemetry signal, transforming how technical teams align their output with the economic health of the business. By the end of this exploration, practitioners will understand how to shift from aggregate billing reports to precise unit economics, ensuring that every architectural decision is both technically sound and financially sustainable.
Bridging the Gap Between Engineering Performance and Financial Reality
Modern observability has reached a pinnacle of technical precision, but it lacks the context of the balance sheet. For years, the industry treated infrastructure costs as a fixed operational expense handled by finance departments, while engineers focused exclusively on uptime and speed. However, in an era of dynamic scaling and consumption-based pricing, a “fast” service that wastes resources is no longer a success; it is a liability. Bridging this gap requires a fundamental shift in perspective, where financial metrics are treated with the same urgency as a memory leak or a network partition.
The integration of cost telemetry allows organizations to move beyond the traditional blame game that occurs when the monthly cloud bill arrives. Instead of reacting to historical data that is thirty days old, engineers can see the real-time financial consequences of their code changes. This alignment ensures that technical excellence translates directly into business value, preventing the “success tax” where a surge in user traffic leads to a disproportionate and unexpected increase in infrastructure overhead.
Beyond the Trinity: Why Traditional Metrics Are No Longer Enough
The established telemetry trinity—logs, metrics, and traces—has served as the gold standard for system visibility for over a decade. While these tools are excellent for diagnosing a crashing pod or a slow database query, they were never designed to monitor system efficiency or fiscal responsibility. In a cloud-native world where every API call, storage I/O operation, and network egress byte has a specific price tag, viewing performance data in a vacuum is inherently misleading and dangerous for the bottom line.
The Disconnect of Parallel Universes
Historically, infrastructure metrics have lived in engineering-centric tools like Prometheus, while financial data remained trapped in monthly CSV exports or CFO-facing billing consoles. This separation creates a reality where engineers do not know the price of the resources they consume, and finance teams do not understand the technical necessity of the spend. Because these two worlds rarely communicate in real-time, the organization loses the ability to make agile adjustments to its spending profile as traffic patterns shift.
The Hidden Cost of Optimization
Technical victories often mask financial ambushes when cost is not part of the observation loop. For instance, an engineer might fix a slow query by adding a comprehensive index, successfully reducing latency by 90% and improving the user experience. However, if that index increases storage IOPS costs by 300%, the net benefit to the company might actually be negative. Without cost telemetry, the engineer celebrates a performance win while the company’s margins quietly erode, illustrating why performance data alone provides an incomplete picture.
The Need for a Financial Lens
Leading organizations have realized that unless cost data lives in the same dashboards as latency data, engineers cannot make informed trade-offs during the development lifecycle. This financial lens transforms observability from a diagnostic tool into a strategic asset. By placing dollar signs next to request counts, teams gain the context needed to prioritize refactoring efforts based on actual ROI rather than just technical curiosity or aesthetic preference for clean code.
Implementing a Cost-Aware Observability Framework
Transitioning to cost-aware observability requires a deliberate shift in how data is collected, tagged, and visualized across the entire stack. This process moves the conversation away from aggregate monthly spending and toward granular operational costs. The goal is to create a feedback loop where the financial impact of a single request or a specific feature launch is visible to the person who wrote the code.
1. Establishing a Foundation of Metadata Discipline
Effective cost attribution is impossible without a rigorous approach to metadata. Before any meaningful analysis can occur, every cloud resource must be identifiable and linked to a specific owner, team, or function. This discipline turns a mountain of undifferentiated cloud spend into an organized map of business activities, allowing for precise accountability across distributed systems.
The Critical Role of Hierarchical Tagging
Standardized tagging is the backbone of financial visibility. Without consistent tags for the team, service, and environment, cloud providers simply deliver a massive, unreadable invoice. Implementing automated enforcement—where resources are automatically terminated or blocked from deployment if they lack proper metadata—is the only proven way to ensure 100% coverage. This ensures that every dollar spent can be traced back to its origin without manual guesswork or forensic accounting.
Context Propagation Across Distributed Traces
In complex microservice architectures, costs often accumulate across multiple downstream services. Utilizing baggage in OpenTelemetry or service mesh headers allows cost-center identifiers to flow through every hop of a request. When a front-end service calls a database, the cost-center ID travels with the request, ensuring that the resulting storage or compute costs are mapped back to the originating user or feature. This propagation provides a holistic view of the total cost of a transaction as it traverses the network.
2. Integrating Cloud Pricing APIs into Technical Dashboards
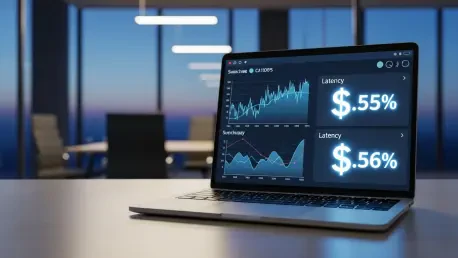
The second phase of implementation involves moving away from retrospective reports and toward real-time financial signals. By connecting technical metrics directly to cloud provider pricing, organizations can generate live cost estimates that reflect current usage. This integration allows for a “dollars-per-minute” view of the infrastructure, providing an immediate warning signal if a deployment causes an unexpected spike in resource consumption.
Correlating Resource Consumption with Rate Cards
Systems must be configured to scrape cloud pricing APIs, such as those provided by AWS or GCP, and join that data with live resource metrics. By multiplying CPU-hours or GB-months by the current rate card, the observability platform can emit a “cost-per-request” metric. This correlation enables developers to see the immediate price of their architectural choices in the same Grafana or Datadog panels they use to monitor system health.
Utilizing Specialized Tooling for Kubernetes and Infrastructure
Containerized environments present unique challenges for cost attribution due to shared resource pools. Specialized tools like Kubecost or OpenCost provide the necessary visibility into pod and namespace spending by calculating the fractional cost of the underlying nodes. These tools allow developers to see the dollar impact of their scaling policies or resource requests within minutes, enabling them to fine-tune their configurations for maximum efficiency without sacrificing stability.
3. Transitioning to Unit Economics for Infrastructure
Aggregate spend is a metric for the finance department, but unit cost is a service-level indicator (SLI) for engineering. Defining success through the lens of efficiency changes the way features are prioritized and built. When engineers understand the cost of a single unit of work, they can make objective decisions about whether a specific feature is worth the infrastructure investment required to support it at scale.
Defining Service-Level Indicators for Cost
Teams should establish and track specific cost-based SLIs, such as “cost per active user” or “cost per gigabyte processed.” When these metrics breach a predefined threshold, they should trigger the same incident response workflows as a latency spike or a high error rate. Treating a cost anomaly as a technical incident ensures that efficiency remains a primary concern during the development and maintenance phases of the software lifecycle.
Predictive Modeling for Feature Launches
Armed with unit cost data, product managers and architects can accurately forecast the financial impact of new features before they reach production. For example, if a team knows the exact compute and egress cost of a standard video stream, they can calculate the projected burn rate of adding high-definition support. This predictive capability allows the business to adjust pricing models or optimization strategies in advance, rather than being surprised by a margin-killing bill after the launch.
Summary of Key Integration Steps
The path to cost-aware observability is built on four practical pillars that integrate financial data into the existing engineering workflow. First, organizations must enforce tagging through automation in the CI/CD pipeline to ensure metadata consistency. Second, they must bridge the gap between cloud billing APIs and time-series databases to provide a real-time view of expenditures. Third, cost metrics must be visualized alongside traditional performance data in developer-facing dashboards to foster a culture of shared responsibility. Finally, cost anomalies must be treated as operational incidents, using statistical baselines to trigger alerts rather than relying on static, outdated budgets that fail to account for healthy growth.
Industry Applications and the Future of FinOps-as-Code
The adoption of cost telemetry is driving a significant cultural shift toward what is becoming known as “FinOps-as-Code.” In highly competitive sectors like SaaS and streaming, where margins are thin, this level of visibility provides a massive strategic advantage. Organizations are increasingly moving toward “cost-aware” autoscalers that query spot instance pricing in real-time to decide whether to scale up a cluster or throttle non-essential background tasks during price spikes. This level of automation ensures that the system always seeks the most economical path toward fulfilling its technical requirements.
As cloud environments grow in complexity, the ability to automate financial guardrails will separate high-margin market leaders from those struggling with runaway overhead. We are entering an era where software will not only be judged by its features and speed but by its financial efficiency. Companies that master the integration of cost telemetry will be able to reinvest their savings into innovation, while their competitors remain bogged down by the “cloud tax” of unoptimized and unmonitored infrastructure.
Conclusion: Making Cost a First-Class Citizen
Observability without cost visibility proved to be a significant blind spot in earlier cloud-native strategies. By integrating financial signals into the daily workflow, engineering teams successfully moved from reactive crisis management to proactive architectural design. This shift did not just save money; it empowered developers to make informed trade-offs between speed, reliability, and expense. Practitioners who began with small steps—such as automating resource tagging and building initial cost-per-transaction dashboards—found themselves better equipped to handle the scaling challenges of the modern market. Moving forward, the industry has embraced the idea that cost is a fundamental engineering metric, ensuring that technical growth remains aligned with long-term business viability. The quarterly budget became a point of pride rather than a source of friction, as transparency turned every engineer into a steward of the company’s resources.