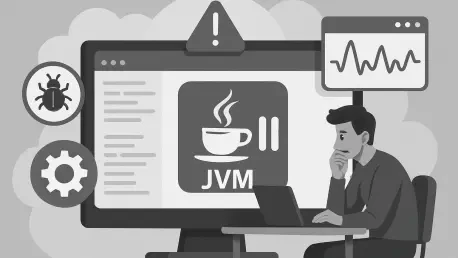
What happens when a system engineered for lightning-fast responses grinds to a halt over something as mundane as a log write, exposing a hidden flaw in a critical setup? In the high-stakes realm of high-performance services, where every millisecond counts, a 15-second pause in a Java Virtual Machine (JVM) can trigger a cascade of failures, disrupting millions of user interactions. This isn’t just a hypothetical scenario—it’s a real-world incident that revealed how even the smallest oversight can bring down a digital titan.
The Stakes of a Stalled Service
In an era where digital platforms handle billions of transactions daily, the reliability of high-performance systems is paramount. A brief interruption, lasting mere seconds, can result in significant financial losses—studies estimate that downtime costs enterprises an average of $5,600 per minute. For a Java-based service processing millions of requests per second, a JVM pause isn’t just a glitch; it’s a direct threat to user trust and operational stability. Understanding these disruptions is crucial for any organization aiming to maintain seamless service in a competitive landscape.
The Incident: A System Under Siege
Picture a bustling Java service, designed to manage an immense volume of user requests with precision. Suddenly, without warning, intermittent 503 errors spike, signaling timeouts at the load balancer level. Web servers stall, refusing new connections for agonizing seconds, while requests pile up and fail. The only clue lies in a curious correlation with heavy disk I/O activity from a co-located caching system on the same host. This anomaly set the stage for a deep dive into an issue that defied initial assumptions.
The impact was staggering. For a platform of this scale, each second of downtime translated into thousands of failed transactions, frustrated users, and potential revenue loss. Teams scrambled to pinpoint the source, sifting through layers of code and infrastructure metrics. What started as a seemingly routine performance hiccup soon revealed itself as a critical flaw lurking in an unexpected corner of the system.
Decoding the Culprit: A Dive into Garbage Collection Logs
After weeks of relentless debugging, the breakthrough came from an unlikely source: the garbage collection (GC) logs. A Young GC pause, expected to last mere milliseconds, clocked a shocking real-world duration of 15.35 seconds. Yet, the CPU time used was just 0.3 seconds, split between 0.25 seconds of user time and 0.05 seconds of system time. This glaring discrepancy meant the JVM was in a Stop-the-World (STW) state, with the thread stuck off-CPU for over 15 seconds, waiting for something beyond its control.
The root cause was astonishingly simple yet devastating. During the STW pause, the JVM attempted to write a log entry to the GC log file—a synchronous operation. With the disk already overwhelmed by competing I/O from the caching system, this write call got queued, stalling the entire application. A process meant to be instantaneous became a choke point, freezing a system that millions depended on, all because of a single line of log data awaiting disk space.
Voices from the Trenches: The Debugging Struggle
An engineer involved in the resolution shared a telling reflection: “Weeks were spent chasing false leads in code and hardware, only to discover the issue was tied to a trivial log write—a detail so minor it was almost invisible.” This sentiment captures the frustration and complexity of diagnosing such elusive bugs in high-performance environments. The lesson resonates with broader industry findings, where I/O contention is cited as a frequent, yet often overlooked, source of latency in JVM applications, according to reports from major tech communities.
This incident isn’t an isolated case. Contributions from teams like those behind Amazon Corretto emphasize that seemingly negligible operations can have outsized consequences when they intersect with critical paths. The debugging journey underscored the necessity of examining every interaction, from application logic to operating system behaviors, to prevent such freezes from derailing services at scale.
Solutions to Thwart Future Freezes
With the root cause identified, actionable strategies emerged to shield systems from similar disruptions. One immediate workaround involved redirecting GC log output to a RAM-backed filesystem like tmpfs, using a configuration such as -Xloggc:/dev/shm/my-app-gc.log. This approach eliminates disk I/O by leveraging memory-to-memory writes, instantly resolving STW pauses. To manage memory risks, rotation flags like -XX:+UseGCLogFileRotation and -XX:GCLogFileSize=10M cap log size, though logs remain ephemeral and require additional setup for persistence.
A more modern solution, available in OpenJDK 17 and later, is asynchronous GC logging, enabled via the -Xlog:async flag. This offloads log writes to a background thread, freeing the STW thread from I/O delays. It’s a cleaner fix, requiring no OS-level adjustments and integrating seamlessly with standard logging pipelines, despite a rare risk of buffer overflow under extreme conditions. This option proves invaluable for teams on current JVM versions seeking robust performance.
Beyond these fixes, broader best practices are essential. Monitoring real versus user+system times in logs can reveal I/O bottlenecks early. Avoiding blocking I/O on critical threads is a must, and in containerized environments, ensuring stdout logging pipelines—such as Fluentd or Vector—are resilient prevents backpressure from stalling applications. These measures collectively fortify systems against unexpected pauses, maintaining predictable performance under load.
Lessons Learned and Paths Forward
Looking back, the resolution of this 15-second JVM freeze became a defining moment for the team, highlighting the fragility of even the most robust systems when minor operations go awry. The painstaking debugging process uncovered not just a technical flaw but a critical gap in anticipating I/O interactions. Each step, from analyzing GC logs to implementing filesystem tweaks, built a stronger foundation for resilience.
The path forward demanded a shift in perspective—prioritizing proactive monitoring of real versus CPU times to catch I/O issues before they escalated. Embracing asynchronous logging where possible and scrutinizing stdout pipelines in container setups emerged as non-negotiable steps. For any organization navigating the complexities of high-performance services, these lessons served as a reminder to safeguard every layer, ensuring that no detail, however small, could freeze a giant again.


