
The fundamental transition from monolithic applications to distributed microservices has irrevocably broken traditional troubleshooting methods, leaving even the most seasoned engineering teams struggling to diagnose complex failures in the opaque, dynamic world of Kubernetes. In the past, debugging was a relatively contained process of connecting to a server and examining local log files. Today, that approach is obsolete. The ephemeral, constantly shifting nature of containerized environments means that without a deliberate and robust observability strategy, teams are effectively operating without visibility.
This new reality demands more than just basic monitoring; it requires a deep, context-rich understanding of system behavior. The challenge is no longer just avoiding downtime but also minimizing the time it takes to resolve inevitable issues. This guide outlines a proven architectural pattern for achieving true observability. By leveraging the combined power of OpenTelemetry for standardized telemetry, Fluent Bit for reliable log transport, and structured logging as a foundational discipline, organizations can move from reactive firefighting to proactive problem-solving, ensuring their systems are not only running but also understood.
Why Traditional Monitoring Fails in Kubernetes
The core deficiency of legacy monitoring tools in a Kubernetes context lies in a fundamental paradigm shift. Traditional monitoring answers the question, “Is the system up?” by tracking known failure modes like CPU utilization or disk space. Observability, in contrast, provides the tools to ask, “Why is the system behaving this way?” This distinction is critical in distributed systems where the number of unknown failure modes is virtually infinite. Without the ability to explore and question system behavior, teams are left guessing at the root cause of an issue.
This operational blindness is exacerbated by several challenges inherent to container orchestration. The most pressing is the ephemeral nature of the data itself. When a pod crashes or is terminated during a scaling event, all its local logs and internal state are permanently destroyed. This means critical evidence needed for post-mortem analysis vanishes before an engineer can even begin an investigation, turning a troubleshooting exercise into an impossible task.
Furthermore, Kubernetes creates fragmented context. A single user request can trigger a chain of interactions across dozens of microservices, each running in a separate pod on a different node. If a downstream service fails, upstream services may only register a generic error, providing no clue as to the origin of the problem. Trying to manually trace that request’s path through scattered log files is an inefficient and often futile effort. This is compounded by the problem of siloed telemetry, where logs, metrics, and traces exist in separate, disconnected systems, making it nearly impossible to correlate a spike in latency with the specific logs and trace that explain it.
The Blueprint Architecting a Unified Telemetry Pipeline
The most effective way to address these challenges is to build a unified telemetry pipeline that standardizes how data is generated and centralizes it for comprehensive analysis. This architecture ensures that regardless of the service or its location in the cluster, all observability data is consistent, correlated, and accessible. The approach rests on three core pillars: structured logging as the data foundation, Fluent Bit for reliable log transport, and OpenTelemetry for unifying metrics and traces into a vendor-agnostic framework.
The Foundation Structured Logging with Propagated Context
The first and most critical step in building an observable system begins not with infrastructure but within the application code itself. All services must be instrumented to emit structured logs, typically in JSON format, instead of ambiguous plain-text lines. This practice transforms logs from human-readable strings into machine-parseable data, enabling powerful filtering, searching, and aggregation at scale.
Beyond structuring the log’s content, the key to unlocking cross-service visibility is propagating context. By adopting the W3C Trace Context standard, each service automatically passes a traceparent HTTP header to any downstream service it calls. This header contains a globally unique trace_id for the entire request and a span_id for the current operation, ensuring that every step of a transaction can be programmatically linked together.
Case in Point The Golden Key of Trace IDs
The real power of this approach becomes evident when the trace_id and span_id are included in every structured log entry. This simple addition acts as the “golden key” that unifies all telemetry data for a specific transaction. Consider a log entry like this:
{"timestamp": "2026-10-27T10:00:05.123Z","level": "error","message": "Failed to process payment","service": "billing-service","trace_id": "0af7651916cd43dd8448eb211c80319c","span_id": "f457718e483a3701","error_code": "5003"}With this single identifier, an engineer can execute a simple query for the trace_id and instantly retrieve every log line from every microservice that was involved in that specific user request. This transforms a multi-hour manual search across disparate systems into a targeted, seconds-long investigation, directly linking an error to its full operational context.
The Transport Layer Shipping Logs Reliably with Fluent Bit
Once applications are generating valuable structured logs, the next challenge is to capture them before they are lost. Because container filesystems are ephemeral, a mechanism is needed to collect and forward logs immediately. Fluent Bit has become the industry standard for this task due to its lightweight footprint, high performance, and extensive plugin ecosystem, making it ideal for deployment at the edge of a cluster.
Fluent Bit is typically deployed as a DaemonSet, which ensures that an agent runs on every single node in the Kubernetes cluster. This agent is configured to automatically tail the log files of all containers running on its node, parse the JSON-formatted data, enrich it with useful Kubernetes metadata like pod name and namespace, and reliably flush it to a configured external destination. This guarantees that no log data is lost, even during pod crashes or node failures.
Real World Pattern Cost Effective Log Storage with S3
While sending logs to a commercial aggregator like Splunk or Elasticsearch is a common practice, the associated costs can become prohibitive for systems that generate terabytes of data daily. A more cost-effective and scalable pattern is to configure Fluent Bit to ship high-volume logs directly to object storage, such as Amazon S3.
This strategy decouples data storage from data analysis. Logs are archived cheaply and durably in S3, and a powerful query engine like Amazon Athena can be used to perform complex, on-demand analysis directly on the stored files. This provides the same powerful querying capabilities as an expensive logging platform but at a fraction of the cost, as you only pay for the queries you run.
The Unification Layer Standardizing Telemetry with OpenTelemetry
The final piece of the architecture addresses the standardization of metrics and traces. Historically, this data was collected using proprietary agents tied to a specific vendor. OpenTelemetry (OTel) solves this problem by providing a single, open-source standard for generating, collecting, and exporting telemetry. By deploying the OpenTelemetry Collector, teams create a vendor-agnostic pipeline that acts as a central hub for all metrics and traces.
The OTel Collector pipeline is composed of three main stages: receivers, processors, and exporters. Receivers ingest data in various formats, such as OTLP or Prometheus. Processors then filter, batch, or enrich this data, for instance, by automatically adding critical Kubernetes metadata to every metric and span. Finally, exporters send the processed telemetry to one or more backends of your choice, whether it is Prometheus, Datadog, or a cloud provider’s service.
Example Future Proofing Your Observability Stack
The most significant impact of this practice is the decoupling of application instrumentation from the observability backend. With the OpenTelemetry Collector in place, developers instrument their code once using the OTel SDK. The operations team can then switch the backend system—for example, migrating from a self-hosted Prometheus instance to a managed Datadog solution—simply by changing a configuration file in the OTel Collector.
This separation provides tremendous long-term flexibility and future-proofs the entire observability stack. Teams are no longer locked into a single vendor and can adapt their tools as their needs evolve, all without requiring any changes to the application code. This agility is invaluable in the rapidly changing cloud-native ecosystem.
The Payoff Transforming a 4-Hour Outage into a 10-Minute Fix
The implementation of this unified architecture fundamentally reshaped troubleshooting workflows from a reactive, guesswork-driven process into a precise, data-driven investigation. Previously, a user-reported error would trigger a frantic search where engineers guessed which service might have failed, manually sifted through scattered and uncorrelated logs, and often found themselves repeating the process as they moved from one upstream service to another. An investigation that should have been straightforward often stretched into a multi-hour outage.
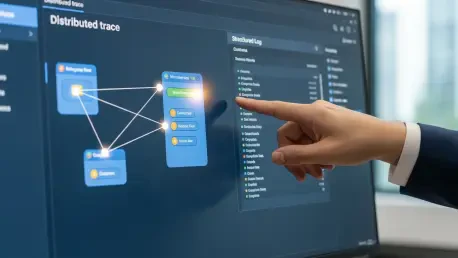
In stark contrast, the “after” scenario demonstrated a dramatic improvement in efficiency. When an alert was triggered, it now contained a trace_id. An engineer used this identifier to query a central dashboard, which immediately visualized the entire request flow across all microservices. The distributed trace highlighted the exact point of failure—for instance, a database timeout in a specific service—and with a single click, the engineer pivoted to view the fully correlated, structured logs for that precise moment. This connected data provided the complete context needed to diagnose and resolve the issue in minutes, not hours.
This architectural pattern proved to be most beneficial for engineering teams managing complex microservice environments. By focusing on establishing a scalable foundation built on connected data, they were able to significantly reduce their Mean Time to Recovery (MTTR). This not only enhanced system reliability but also freed up valuable engineering resources to focus on innovation and growth rather than perpetual firefighting.


