
The seemingly endless task of manually transcribing data from PDF tables into spreadsheets has quietly consumed countless hours of productivity from skilled professionals across finance, research, and enterprise operations. This tedious process, a persistent bottleneck in an otherwise automated world, represents a significant hidden cost in modern data workflows. While PDFs are the undisputed standard for distributing structured reports, their inherent design makes them notoriously hostile to automated data extraction. This paradox—a format built for visual consistency but not for machine readability—has long forced analysts into a cycle of copying, pasting, and painstakingly correcting errors. However, a new generation of intelligent parsing tools is emerging, threatening to make this manual drudgery a relic of the past.
The Hidden Costs of Copying Tables From PDFs to Excel
For decades, the standard procedure for handling financial reports, regulatory filings, or market research delivered as PDFs has been frustratingly manual. An analyst receives a crucial document, such as a quarterly earnings release, and begins the laborious process of highlighting tables, copying the data, and pasting it into an Excel worksheet. This is rarely a clean transfer. More often than not, the process results in misaligned columns, jumbled text, and numbers that are mistakenly interpreted as text, requiring significant manual cleanup before any actual analysis can begin. This ritual is not just inefficient; it is a profound waste of human capital, diverting highly paid experts from high-value tasks like modeling and strategic analysis to what is essentially digital clerical work.
The cumulative effect of this inefficiency is staggering. When scaled across an entire organization or industry, these seemingly small delays add up to thousands of lost work hours annually. The problem is compounded by the high stakes involved; a single misplaced decimal or a misread negative value in a financial statement can lead to flawed models and poor decision-making. The pressure to work quickly increases the likelihood of such human errors, creating a vicious cycle of inefficiency and risk. Consequently, what appears to be a simple data transfer task is, in reality, a significant operational drag and a source of potential inaccuracies that can have far-reaching consequences.
Why Traditional PDF Table Extraction Fails So Often
The fundamental challenge in extracting data from PDFs lies in the format’s design philosophy. A PDF is a graphic container, essentially a digital piece of paper. Its primary goal is to preserve a document’s visual layout across different devices and operating systems. To achieve this, a PDF stores information as a collection of text objects and vector graphics placed at specific coordinates on a page. It lacks the underlying semantic structure of a true data document; there is no inherent concept of a “table,” “row,” or “cell.” This distinction is critical, as it explains why traditional extraction tools, which often rely on simple text scraping or rudimentary spatial analysis, frequently fail.
This structural limitation gives rise to several common failure points that plague legacy data extraction software. For instance, financial tables often feature complex merged headers where a single category spans multiple sub-columns. A simple parser sees this only as separate text elements and cannot reconstruct the hierarchical relationship, leading to lost context and jumbled data. Similarly, accounting conventions, such as using parentheses to denote negative numbers like (123), are often misinterpreted as text strings rather than numeric values, requiring manual conversion. When tables are designed without visible borders for aesthetic reasons, tools that rely on line detection to identify table boundaries become completely ineffective, often missing tables entirely or incorrectly merging disparate sections of text.
Furthermore, the prevalence of scanned documents introduces another layer of complexity. These image-based PDFs must first be processed with Optical Character Recognition (OCR) technology to convert the images of text into machine-readable characters. However, OCR is an imperfect science. It can introduce subtle errors, such as misinterpreting an “8” for a “B” or adding extraneous whitespace, which corrupts the data. Complex cell spanning and column misalignments, even in digital-native PDFs, can further confuse parsers, resulting in data being placed in the wrong columns. These inherent flaws mean that even with automated tools, a significant manual verification and cleanup step has remained an unavoidable part of the workflow for years.
A Modern Python Library for a Modern Data Problem
In response to these persistent challenges, a new approach has materialized in the form of specialized, layout-aware parsing libraries. One prominent example is the open-source Python package pdf-tables-to-excel, which leverages an advanced document parsing engine known as Docling. Unlike its predecessors, this tool does not just read the text on the page; it analyzes the document’s geometric structure. By detecting the precise coordinates of text blocks, understanding whitespace, and identifying visual cues, it can reconstruct the logical layout of tables with remarkable accuracy, even in complex documents where other tools fail. This layout-aware methodology allows it to correctly interpret merged headers, spanned cells, and tables without borders, producing a clean data structure from the outset.
The key differentiator of this modern solution is its commitment to an end-to-end workflow. Traditional libraries typically stop after extracting the data into a raw format, such as a Pandas DataFrame, leaving the final, crucial steps to the user. This “last mile” of the process—converting text representations of percentages and currencies into true numeric formats, styling the spreadsheet for readability, and organizing multiple tables into separate sheets—is where analysts still lose significant time. The pdf-tables-to-excel library automates these steps. It intelligently converts financial negatives, percentages, and currencies into their proper numeric equivalents and uses this clean data to generate a fully formatted, analysis-ready Excel file, complete with appropriate borders, bolded headers, and auto-fitted columns.
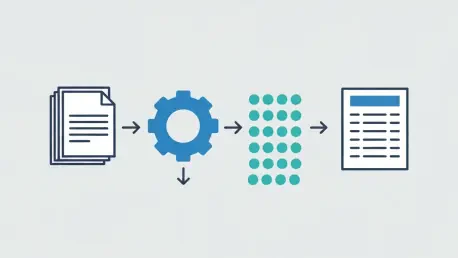
Underpinning this functionality is a sophisticated three-layer technical architecture. The first layer, the extraction engine, uses the Docling parser to identify table structures and output them as structured objects that contain not just the text but also geometric and contextual metadata. The second layer is a powerful normalization engine that systematically cleans the extracted text, converting it into true numeric values ready for analysis. Finally, an Excel formatting engine, built with robust libraries like XlsxWriter, takes the normalized data and programmatically builds a polished, professional-grade spreadsheet. This integrated pipeline transforms a multi-step, error-prone manual process into a single, reliable command.
The Philosophy of Zero Manual Cleanup
The development of such a comprehensive tool was driven by a philosophy born from observing a universal pain point across industries. It was designed with an opinionated view: the ultimate goal of data extraction is not a raw data object but a final, usable document that requires no further human intervention. This perspective shifts the definition of success from simply “extracting the data” to “delivering an analysis-ready asset.” By focusing on the end-user’s complete workflow, this approach aims to eliminate the manual cleanup stage that has long been accepted as a necessary evil.
This user-centric vision is built upon three core design principles. The first and most important is to achieve zero manual cleanup. Every feature, from numeric normalization to spreadsheet styling, is designed to produce an Excel file that an analyst can immediately use for modeling, reporting, or visualization. The second principle is to ensure predictable and deterministic behavior. In data automation, consistency is paramount. By relying on a structured layout model rather than fragile heuristics, the tool delivers stable and repeatable results, giving users confidence in the automated output. The third principle is to offer a “batteries-included” experience, bundling all necessary functionalities into a single, easy-to-use package. This eliminates the need for users to write boilerplate code for common tasks like formatting or multi-table handling, making powerful automation accessible to a broader audience.
Putting Automated Extraction into Practice
The practical implementation of this modern approach is designed for simplicity and accessibility. For developers and data analysts comfortable with Python, getting started involves a one-command installation of the open-source library. The basic workflow is remarkably streamlined: a user simply points the tool at a PDF file, and with a few lines of code, it automatically detects all the tables within the document and exports them to a cleanly formatted Excel workbook. Each table is placed on its own sheet, named sequentially or by its page number, making the output immediately organized and easy to navigate. This ease of use dramatically lowers the barrier to automating what was once a highly manual task.
The applications for this technology span a wide range of industries and use cases. In financial services, analysts can now automate the extraction of data from earnings releases, 10-K filings, and complex loan tapes, accelerating research and reporting cycles. For data scientists, it provides a reliable method for structuring large datasets from PDF-based sources, preparing them for machine learning pipelines without tedious pre-processing. In the realm of enterprise automation, this capability can be integrated directly into Extract, Transform, Load (ETL) systems and Robotic Process Automation (RPA) workflows, enabling companies to build robust, scalable solutions for document intelligence and unlock the value trapped within their vast archives of PDF reports.
The arrival of sophisticated, layout-aware parsing tools marked a pivotal moment in the evolution of data processing. It signaled a definitive move away from accepting the limitations of the PDF format and toward demanding intelligent, automated solutions. The ability to reliably transform visually structured reports into functionally structured data has not only saved countless hours of manual labor but has also enhanced data accuracy and accelerated the pace of analysis. This technological shift represented more than just a new tool; it was a fundamental change in how organizations could interact with one of their most common sources of information, finally allowing professionals to focus on interpreting data rather than just liberating it.


