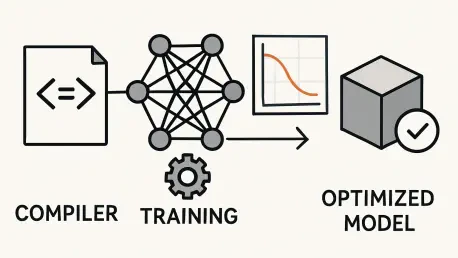
In the fast-evolving landscape of machine learning, where training jobs often span days, a staggering bottleneck can hide in the most unexpected places, such as the underlying compiler stack. Consider a scenario where a 60-hour training job for a complex neural network drags on due to inefficiencies not in the model or data, but in the compiler itself, revealing a hidden opportunity for optimization. This guide unveils a remarkable case where addressing such a compiler issue slashed an impressive 16 hours off training time, transforming performance overnight. The purpose here is to equip practitioners with actionable insights into identifying and resolving compiler bottlenecks to achieve significant time savings in ML workflows.
The importance of this guide lies in its focus on an often-overlooked aspect of ML infrastructure: the compiler. While much attention typically goes to optimizing model architectures or streamlining data pipelines, compiler behavior can quietly dictate the efficiency of GPU utilization and, by extension, the duration of training jobs. This narrative promises to reveal a real-world journey of debugging and optimization, providing a roadmap for tackling similar challenges in any ML environment.
By following this detailed exploration, readers will learn to spot inefficiencies in their own systems, apply specialized tools for diagnosis, and navigate the trade-offs and infrastructural impacts that follow such fixes. The focus areas include pinpointing issues within the compiler stack, leveraging debugging techniques, and understanding the broader implications of optimization decisions. This is not just a story of time saved, but a practical handbook for enhancing ML performance through deep system understanding.
The Hidden Role of Compilers in Machine Learning Performance
Compilers play a pivotal role in the performance of machine learning systems, yet their impact often remains underappreciated amidst the focus on higher-level components. As models grow in complexity and datasets expand, the compiler stack becomes a critical determinant of how efficiently hardware resources like GPUs are utilized. Without optimized compilation, even the most advanced architectures can suffer from prolonged training times due to inefficiencies at the lowest levels of execution.
Historically, optimization efforts in ML have centered on refining neural network designs or accelerating data preprocessing, while compiler behavior has been treated as a black box. This oversight can lead to significant performance gaps, as subtle misconfigurations or regressions in compiler passes can cause operations to execute inefficiently. For instance, in a case involving TensorFlow, TensorRT, and TVM (Tensor Virtual Machine), a regression in the compiler stack resulted in unfused operations, leading to GPU under-utilization and extended training durations.
The consequences of neglecting compiler optimization are not merely theoretical but can manifest as tangible delays in project timelines and inflated computational costs. In the referenced scenario, a 60-hour training job revealed stark inefficiencies upon closer inspection, highlighting how compiler issues can bottleneck even well-designed systems. This underscores the need for practitioners to expand their optimization lens to include the compiler layer, ensuring that every component of the ML stack operates in harmony to deliver peak performance.
Breaking Down the Compiler Fix: A Step-by-Step Journey
Delving into the specifics of how a compiler fix reduced training time by 16 hours offers a clear path for others to replicate such success. This section outlines the meticulous process of diagnosing and resolving a critical bottleneck in a 60-hour training job, breaking it down into actionable phases. Each step provides technical depth and practical guidance for addressing similar issues in diverse ML environments.
The journey involves navigating complex challenges, from identifying root causes of inefficiency to implementing targeted solutions and managing downstream effects. By following these detailed steps, practitioners can gain a comprehensive understanding of compiler optimization and its impact on training efficiency. The process is presented in a logical sequence to ensure clarity and applicability across different setups.
Step 1: Identifying GPU Under-Utilization in Training Jobs
The first step in tackling the prolonged training time was to conduct thorough profiling of the 60-hour job, which revealed significant GPU under-utilization. Despite healthy surface-level metrics, the system was not leveraging the full potential of the hardware due to inefficiencies during quantized inference. This initial discovery pointed to deeper issues within the operation execution pipeline that needed immediate attention.
Pinpointing Unfused Operations in TVM Relay IR
Further investigation uncovered a regression in the TVM Relay Intermediate Representation (IR) that prevented operations from being fused effectively. Unfused operations led to frequent memory stalls, as data transfers between separate operations bogged down the GPU’s processing capabilities. Recognizing this specific issue in the IR layer was crucial to understanding why the training job lagged behind expected performance benchmarks.
Step 2: Debugging with Specialized Tools and Techniques
With the problem identified, the next phase involved a detailed debugging process using specialized tools to inspect and analyze the compiler stack. This step required a granular approach to dissect the transformation paths within the IR and detect where inefficiencies originated. The use of targeted diagnostic methods ensured that the root cause was addressed with precision.
Leveraging relay.analysis for Pattern Matching
One key tool in this process was relay.analysis, which facilitated pattern matching within IR blocks to identify unintended separations of operations. By mapping out problematic transformation patterns, it became possible to isolate the specific compiler passes responsible for the inefficiencies. This analytical approach provided critical insights into the behavior of the compiler under specific workload conditions.
Crafting Custom Lowering Paths for GPU Targeting
To resolve the identified issues, custom lowering paths were developed to optimize how operations were mapped to GPU architectures. These tailored paths addressed compiler misinterpretations that led to suboptimal execution, ensuring that operations were fused appropriately for maximum hardware efficiency. This customization was a pivotal move in restoring the system’s performance to its full potential.
Step 3: Implementing Fixes and Calibration Adjustments
Following the diagnostic phase, specific fixes were applied to rectify the compiler bottleneck and enhance training efficiency. This involved technical adjustments like re-quantization using percentile calibration to stabilize inference processes. Additionally, certain problematic TensorRT fusions were disabled to prevent further performance degradation during execution.
Adjusting TensorRT Calibration for Symmetric Scaling
A critical adjustment was made to TensorRT calibration ranges to avoid asymmetric scaling issues that could skew inference results. By ensuring symmetric scaling, the system maintained consistency in how data was processed, which directly contributed to the overall speedup. This calibration tweak was essential for aligning the compiler’s behavior with the demands of the training job.
Step 4: Managing Infrastructural Ripples Post-Optimization
The final step extended beyond technical fixes to address the broader infrastructural impacts of the compiler optimization. Changes at the compiler level rippled through the entire ML pipeline, necessitating updates to deployment systems and monitoring mechanisms. This phase ensured that the performance gains were sustainable and did not introduce new vulnerabilities.
Ensuring Reproducibility with IR Checkpoint Hashing
To maintain traceability and reproducibility, IR checkpoint hashing was introduced alongside version control for compiled artifacts. This mechanism allowed for consistent tracking of compiler outputs, ensuring that future iterations of the training job could replicate the optimized conditions. Such measures were vital for preserving the integrity of the system over time.
Addressing Dependency Mismatches in Deployment
Deployment pipelines, particularly in SageMaker Edge containers, faced challenges like dependency mismatches post-optimization. Resolving these discrepancies required careful alignment of software versions and configurations across the infrastructure. This step was necessary to prevent disruptions in production environments and ensure seamless integration of the optimized compiler stack.
Key Takeaways from the 16-Hour Training Time Reduction
This section distills the critical lessons and steps from the optimization journey into a concise reference list for quick application:
- Discovered GPU under-utilization stemming from unfused operations within TVM Relay IR, highlighting the need for deep profiling.
- Employed relay.analysis alongside custom lowering paths to diagnose and optimize compiler transformations with precision.
- Achieved a 5x speedup through re-quantization and TensorRT calibration adjustments, significantly cutting training duration.
- Navigated infrastructural impacts by implementing IR checkpoint hashing and resolving deployment dependency issues.
- Balanced performance improvements against trade-offs, such as minor accuracy reductions in specific edge deployment scenarios.
Broader Implications for ML Infrastructure and Future Challenges
The success of this compiler optimization sheds light on broader trends within ML infrastructure, particularly the growing necessity for visibility into compiler behavior. As models and hardware diversify, the risk of undetected regressions increases, making robust monitoring and diagnostic tools indispensable. This case exemplifies how a single bottleneck can expose systemic vulnerabilities that demand ongoing attention.
Looking ahead, future challenges include striking a balance between speed and accuracy across varied hardware environments. The diversity of deployment targets complicates the generalization of optimizations, often requiring tailored solutions for each context. Additionally, the need for behavior-focused benchmarking over raw speed metrics is emerging as a best practice to ensure holistic performance evaluation.
Another pressing issue is the communication of technical trade-offs to non-technical stakeholders. Explaining why faster execution might compromise reliability or accuracy remains a hurdle in aligning infrastructure decisions with business goals. Addressing this gap requires developing clear frameworks for translating complex optimizations into accessible insights, fostering collaboration across teams.
Final Thoughts: Harnessing Compiler Power for ML Efficiency
Reflecting on the journey, the reduction of training time by 16 hours through a compiler fix stands as a testament to the value of deep system visibility and strategic problem-solving in ML performance engineering. Each step, from profiling inefficiencies to managing deployment ripples, contributed to a transformative outcome that reshaped the efficiency of the training process. The meticulous debugging and optimization efforts underscored how critical the compiler layer is to achieving such gains.
Moving forward, practitioners are encouraged to inspect their own compiler stacks for hidden inefficiencies that might be inflating training times. A proactive approach could involve integrating diagnostic tools into regular workflows to catch regressions early. Additionally, building internal dashboards to track compiler behavior over time can serve as a preventive measure against future bottlenecks.
As a next step, consider prioritizing understanding over the adoption of new tools, focusing on dissecting existing systems to uncover potential improvements. Collaborating with hardware and software teams to align optimizations with specific deployment needs can further enhance outcomes. This mindset of perseverance and critical analysis remains essential for navigating the intricate challenges of ML infrastructure optimization.


