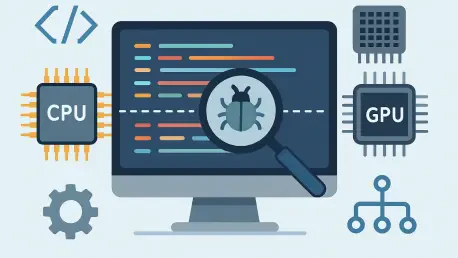

Postmortem debugging for GPUs now utilizes a common base class for core-dump analysis across different hardware vendor implementations. This development marks a significant shift in how developers approach the debugging of complex AI and high-performance computing workloads that move seamlessly between general-purpose processors and specialized accelerators. In the current landscape of 2026, the reliance on high-level frameworks means that a single execution path frequently traverses different architectural boundaries, making it notoriously difficult to pinpoint errors. Traditional tools often fail because they treat the central processing unit and the graphics processing unit as isolated islands, forcing developers to switch between disparate environments. By implementing a vendor-neutral architecture within the LLDB framework, engineers can now bridge this gap, ensuring that the intricacies of modern silicon do not hinder the pace of software innovation. This design represents the CPU and GPU as separate processes while presenting them in a single session.
1. Detect Backend Capabilities: Discovery and Architecture
The process starts when LLDB establishes a communication link with its companion server, lldb-server, which is specifically designed to handle low-level operations. During this initial handshake, the server queries the available hardware environment to identify any specialized accelerator plugins that have been registered by various hardware vendors. This identification process is critical because it allows the debugger to remain flexible and adaptive to the underlying hardware without requiring a hard-coded understanding of every possible GPU variant on the market. By scanning for these specific plugins at startup or during the attachment phase, LLDB can dynamically adjust its internal models to accommodate the presence of heterogeneous computing resources. This ensures that the debugging session is properly configured from the very beginning, allowing for a smooth transition from standard CPU-based inspection to the high-concurrency environments typically found on modern graphics hardware or specialized neural engines.
Furthermore, this architecture ensures that the primary LLDB client remains entirely vendor-neutral, delegating hardware-specific complexities to the server-side plugins. The communication between these components is conducted using the GDB remote protocol, which has been extended to support the nuances of accelerator management and discovery. This separation of concerns means that core debugger features, such as advanced symbol handling or integrated development environment support, do not need to be rewritten for every new generation of specialized hardware. Instead, hardware manufacturers provide a focused implementation that interacts with the lldb-server through a standardized interface, effectively shielding the end user from the underlying plumbing. This design choice fosters a more inclusive ecosystem where new accelerators can be integrated into a world-class debugging environment with significantly less effort than building a standalone tool from scratch, promoting consistency across development platforms.
2. Establish Runtime Triggers: Coordinating the Host
Once the available capabilities are detected, the system must determine exactly when to start monitoring device-side execution, which is achieved through the establishment of runtime triggers. The accelerator plugin directs the debugger to set internal, transparent breakpoints within the host application code where the GPU driver or runtime is expected to initialize. These markers are essential for identifying the precise moment a workload shifts from the host processor to the accelerator, allowing the debugger to prepare for state changes without disrupting the normal flow of the application. Unlike standard user-defined breakpoints, these internal markers function as silent listeners that monitor the execution environment for specific signals of device activity. This approach avoids the massive overhead that would occur if the debugger attempted to monitor all GPU interactions constantly, focusing instead on high-value events such as kernel launches or memory transfers between the host and the device.
These markers serve as critical synchronization points that align the disparate timelines of the CPU and the GPU, ensuring that the debugger is always in the right place at the right time. When the host application reaches one of these predefined points, the runtime environment provides the necessary context to signal that a device-side debugging session is ready to commence. This mechanism is particularly important in 2026, where dynamic scheduling and asynchronous execution models are the norm rather than the exception. By utilizing these internal triggers, the framework can effectively bridge the gap between the synchronous world of traditional software and the highly parallel, often unpredictable world of accelerator execution. This ensures that the developer can maintain a cohesive view of the entire application logic, regardless of which hardware component is currently processing the data. Such coordination is the bedrock of effective heterogeneous debugging, as it prevents the loss of state information.
3. Prepare the Hardware Interface: Vendor API Activation
When the host application hits a designated trigger, the lldb-server immediately alerts the relevant hardware plugin to begin the preparation of the hardware interface. This activation step involves the plugin engaging with the manufacturer’s specific application programming interface and driver stack to initialize low-level debugging hooks. Because each hardware vendor has a unique method for exposing register states, memory maps, and instruction pointers, the plugin acts as a vital translator between vendor-specific hardware realities and the standardized abstractions expected by the LLDB client. This stage is where the heavy lifting of device control occurs, including the setup of communication channels that allow the debugger to read and write to the accelerator’s internal memory space. By isolating this logic within the plugin, the architecture ensures that the main debugger remains clean and performant, avoiding the bloat that would come from including every possible driver interaction in the codebase.
Following the activation of the vendor API, the plugin readies a dedicated debugging endpoint that provides a gateway to the accelerator’s internal state. This endpoint is configured to handle the high-volume data streams associated with GPU debugging, where thousands of threads might be active simultaneously and requiring inspection. The preparation phase also includes the validation of the device’s current state, ensuring that the hardware is in a stable condition for inspection and that the necessary debugging symbols for the device-side code have been correctly indexed. By finalizing this interface before the developer attempts to inspect the device, the system provides a robust and responsive experience that mimics the feel of local CPU debugging. This level of readiness is essential for maintaining developer productivity, as it eliminates the delays often associated with manual device attachment or environment configuration. The result is a seamless transition from host-side logic to kernels.
4. Initialize the Device Target: Managing Heterogeneous State
With the hardware interface prepared, the next logical step involves LLDB generating a secondary target specifically for the accelerator and linking to it. This design pattern treats the GPU not as a subset of the CPU process but as a distinct entity with its own architecture, memory layout, and execution model. By creating a separate target, the debugger can maintain a clear logical boundary between the host and the device, which is necessary because they often operate in different address spaces where the same memory address might point to entirely different physical locations. This dual-target approach allows the developer to switch contexts between the CPU and GPU within the same session, using familiar commands to inspect both sides of the application. It preserves the integrity of the host’s state while providing deep visibility into the accelerator’s performance, threads, and register values, ensuring that the complexities of one do not interfere with the analysis of the other during a critical debugging session.
This stage also allows the debugger to manage device-specific threads, memory, and registers using its standard framework, effectively normalizing the representation of the accelerator’s highly parallel nature. Instead of inventing a new set of metaphors for GPU execution, the framework maps the thousands of execution lanes onto the existing thread model that developers already understand. This normalization is crucial for compatibility with integrated development environments and graphical debugging tools, which rely on a consistent set of abstractions to display information to the user. The debugger manages the mapping of these lanes to thread IDs, providing a searchable and filterable view of the massive parallelism inherent in modern GPU workloads. Consequently, developers can set breakpoints in device kernels, step through machine instructions on the accelerator, and inspect the values of registers with the same level of precision they expect from standard CPU development. This unified management represents a significant leap in productivity.
5. Practical Implementation: Case Studies and Future Progress
The practical implementation of this framework has already shown significant benefits in large-scale production environments where heterogeneous computing is the primary driver of performance. Engineers at Meta and across the broader open-source ecosystem have utilized this architecture to debug complex AI models and distributed computing tasks that span diverse hardware fleets. Because the plugin boundary is based on general debugger operations rather than a specific vendor’s concepts, it has proven remarkably resilient to changes in hardware design and runtime software. This flexibility allows organizations to adopt new accelerators from different manufacturers without having to retrain their engineering teams on a completely different set of diagnostic tools. Furthermore, the inclusion of a mock accelerator plugin in the testing suite ensures that the common infrastructure is continuously validated, even in environments where the physical hardware is not present. This commitment to testing results in a stable toolchain.
Moving forward, the focus shifted toward expanding the ecosystem of vendor-specific plugins and refining the coordination between the host and accelerator targets. Organizations looking to leverage this technology prioritized the development of LLDB-compatible plugins for their custom silicon to ensure full visibility into their hardware’s execution. It was observed that early adoption of these standardized interfaces reduced the time spent on tool maintenance and allowed teams to focus on optimizing the actual performance of their kernels. The community worked toward upstreaming the remaining components of the framework to ensure that every developer using LLVM could benefit from these advancements. Future considerations included the integration of more advanced telemetry and real-time performance monitoring directly into the debugging flow to provide even deeper insights into how code interacts with the underlying silicon. By following these patterns, developers transitioned to a more unified workflow for managing complexity.