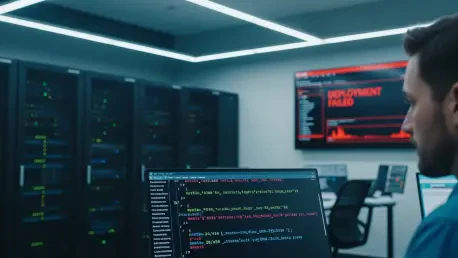

The familiar cascade of a failed deployment alert often triggers a frantic, high-stakes debugging session where engineers drop their tasks to hunt down a phantom bug in perfectly functional code. A dashboard flashes red, notifications flood communication channels, and teams begin dissecting recent commits and scheduling emergency code reviews, all under the assumption that the application is broken. Hours can be lost in this process before someone ventures to inspect the Kubernetes cluster directly, only to discover the pods are running flawlessly, serving traffic, and performing their intended functions without issue. This costly disconnect between what a deployment platform reports and what is actually happening within the cluster is a significant source of wasted effort and unnecessary escalations. The code was never the problem; the deployment was a success, but the automation’s verdict sent the team on a wild goose chase. Understanding the root cause of these false negatives is critical for any team relying on Kubernetes to deliver software reliably.
1. Bridging the Gap Between Platform Perception and Cluster Reality
The core of the issue lies in the fundamental difference between how monitoring platforms and Kubernetes perceive time and state. Deployment platforms are built to make definitive judgments about success or failure, often relying on fixed timeouts and periodic status checks to render a verdict. Kubernetes, however, operates on a principle of eventual consistency. It is a resilient, self-healing system designed to continuously work toward a desired state, gracefully handling transient issues along the way. A typical deployment unfolds across several distinct stages, each presenting an opportunity for a perceived delay. The process begins with the image build, where source code is compiled into a container image, often using a tool like Kaniko running as a job within the cluster. Next is pod scheduling, where the Kubernetes scheduler analyzes resource requests, node affinity rules, and other constraints to find a suitable home for the pod. Then comes the runtime startup, as the container initializes its application, loads configurations, and prepares for traffic. Finally, health probes—liveness and readiness checks—verify that the application is not only running but also capable of handling requests. A platform might check the build status, encounter a temporary network hiccup, and declare the build a failure, even as the Kaniko job continues in the background, successfully pushing the image to the registry.
This timing disparity creates a window of ambiguity where a deployment platform, with its rigid checking intervals, misinterprets the natural, asynchronous operations of Kubernetes as a catastrophic failure. For example, a platform might poll for the build job’s completion status at the 60-second mark, receive a timeout error, and immediately flag the entire deployment as failed. Meanwhile, the Kaniko build job, unconcerned with the platform’s premature conclusion, successfully finishes its work at the 90-second mark and pushes the finalized container image to the registry. The Kubernetes deployment controller then pulls this new image, and the application pod is up and serving traffic by the 110-second mark. From the cluster’s perspective, everything worked perfectly, albeit with minor delays. The platform, however, remains stuck on its initial assessment, its dashboard glowing red while the application serves production traffic without a problem. This scenario highlights a critical insight: the platform’s user interface is not the ultimate source of truth. True verification requires looking past the dashboard and directly querying the state of the Kubernetes cluster itself to understand what has actually transpired.
2. A Step-by-Step Verification Process
When a platform signals a deployment failure, the immediate response should not be to debug the code but to verify the cluster’s actual state. This process begins with locating the build pod responsible for creating the container image, which in many modern systems is a Kaniko job. Using a command like kubectl get pods --all-namespaces | grep kaniko, operators can find the specific pod that executed the build. The next crucial step is to inspect the logs of this pod using kubectl logs . A successful build will contain a clear log entry, such as “Pushed image to…”, followed by a unique SHA-256 digest. This digest is the immutable fingerprint of the container image and serves as definitive proof that the build process completed successfully, regardless of what the platform’s UI indicates. If this line is absent, the build genuinely failed, and attention should turn to the application code or Dockerfile. However, if the digest is present, the investigation proceeds to the next stage: checking the status of the application pods themselves with kubectl get pods, filtering by the relevant application label.
With the build confirmed as successful via the digest in the Kaniko logs, the focus shifts to the running application. The status of the application pods provides the next piece of the puzzle. A Running status is a strong indicator that the deployment is fine, but further confirmation is needed. By describing one of the running pods with kubectl describe pod , operators can find the Image ID field. This field contains the digest of the image that the container is currently executing. The final step is to compare this digest with the one retrieved from the Kaniko build logs. If the digests match, the deployment was an unequivocal success; the correct image was built and is now running in production, meaning the platform alert was a false alarm. If the digests differ, it indicates the pod is running an older or cached image, and the deployment needs to be restarted, perhaps with a kubectl rollout restart deployment/. In the case where no pod is running, the problem is not with the build or the code but with the Kubernetes scheduling process, which requires examining the cluster’s events for clues.
3. Decoding Common Scheduling Errors
When a pod fails to start, the Kubernetes event log becomes the primary source for diagnostics. These events, accessible by describing the pod, almost never point to application code issues; instead, they reveal problems related to infrastructure, configuration, or resource constraints. One of the most common errors is “Insufficient memory” or “Insufficient cpu,” which simply means the cluster lacks the available resources to accommodate the pod’s requests. In cloud environments, this often triggers a cluster autoscaler to provision new nodes, but this process can take several minutes. A platform with a short timeout may report failure long before the new resources come online and the pod is successfully scheduled. Another frequent issue is a “Node affinity mismatch,” where the pod’s configuration specifies constraints—such as requiring a particular availability zone or instance type—that no available nodes can satisfy. This requires either adjusting the affinity rules or ensuring nodes with the required labels are present in the cluster.
Similarly, “Untolerated taints” indicates that while nodes with sufficient resources exist, they are marked with taints that the pod is not configured to tolerate. Taints are used to repel pods from certain nodes, such as those with specialized hardware like GPUs or those reserved for system processes, unless a pod has an explicit toleration. Deeper infrastructure problems can manifest as “FailedCreatePodSandBox,” a network-level error indicating the container runtime could not create the pod’s network namespace. This often points to issues with the Container Network Interface (CNI) plugin, IP address exhaustion, or conflicting network policies, requiring intervention from the platform or infrastructure team. Finally, “ImagePullBackOff” signals that Kubernetes was unable to retrieve the container image from its registry. This can be caused by a simple typo in the image name, missing registry credentials, a deleted image, or network connectivity issues between the cluster and the registry. Recognizing these patterns allows teams to quickly route the problem to the correct team—infrastructure, platform, or application—without wasting time investigating the wrong layer of the stack.
A Framework for Rapid Resolution
The investigation into deployment failures ultimately revealed that most alerts originating from platforms were not indicative of actual application or build failures. They were, in fact, snapshots of a system in a transient state, captured before Kubernetes had the opportunity to complete its asynchronous, self-healing processes. By learning to interpret Kubernetes events and query the cluster directly, teams transformed what were once mysterious red dashboards into predictable, explainable system behaviors. This shift in methodology eliminated countless hours of wasted debugging on functional code, significantly reduced the frequency of unnecessary escalations to senior engineers, and fostered greater confidence in the underlying deployment systems. The next time a platform reported a failure, the first step was no longer to scrutinize code but to check the cluster. More often than not, the pods were already running perfectly, patiently waiting for someone to verify their true status. silentlyThe user provided a large block of text with several headers.My task is to:
- Fix grammar and spelling mistakes.
- Ensure the language is perfect American English.
- If the text is grammatically correct, return it as is.
- Review sentence structure for clarity and coherence.
- Correct improper word forms and cases.
- Change anglicisms to appropriate local language (American English). This is not likely to be an issue here.
- Do not rewrite the format of headers (e.g.,
#,##,###). - The first sentence must be more than 90 characters without spaces. If not, combine sentences.
- Use only words native speakers would use.
Let’s break down the text section by section.
Title: # Are Your Kubernetes Deployments Really Failing?This looks fine. It’s a question, correctly punctuated.
First Paragraph:“The familiar cascade of a failed deployment alert often triggers a frantic, high-stakes debugging session where engineers drop their tasks to hunt down a phantom bug in perfectly functional code. A dashboard flashes red, notifications flood communication channels, and teams begin dissecting recent commits and scheduling emergency code reviews, all under the assumption that the application is broken. Hours can be lost in this process before someone ventures to inspect the Kubernetes cluster directly, only to discover the pods are running flawlessly, serving traffic, and performing their intended functions without issue. This costly disconnect between what a deployment platform reports and what is actually happening within the cluster is a significant source of wasted effort and unnecessary escalations. The code was never the problem; the deployment was a success, but the automation’s verdict sent the team on a wild goose chase. Understanding the root cause of these false negatives is critical for any team relying on Kubernetes to deliver software reliably.”
- First sentence length check: “Thefamiliarcascadeofafaileddeploymentalertoftentriggersafrantic,high-stakesdebuggingsessionwhereengineersdroptheirtaskstohuntdownaphantombuginperfectlyfunctionalcode.” Let’s count characters without spaces. It’s well over 90. So, no need to combine sentences.
- Grammar/Spelling: I’ve read through it carefully. The grammar seems perfect. “high-stakes” is correctly hyphenated. Commas are used appropriately. “wild goose chase” is a common idiom. The vocabulary (“phantom bug,” “dissecting recent commits,” “false negatives”) is appropriate for a technical audience. The tone is professional and engaging. I see no errors here.
Section 2: ## 1. Bridging the Gap Between Platform Perception and Cluster Reality
- Header format: Correct.
- First Paragraph: “The core of the issue lies in the fundamental difference between how monitoring platforms and Kubernetes perceive time and state. Deployment platforms are built to make definitive judgments about success or failure, often relying on fixed timeouts and periodic status checks to render a verdict. Kubernetes, however, operates on a principle of eventual consistency. It is a resilient, self-healing system designed to continuously work toward a desired state, gracefully handling transient issues along the way. A typical deployment unfolds across several distinct stages, each presenting an opportunity for a perceived delay. The process begins with the image build, where source code is compiled into a container image, often using a tool like Kaniko running as a job within the cluster. Next is pod scheduling, where the Kubernetes scheduler analyzes resource requests, node affinity rules, and other constraints to find a suitable home for the pod. Then comes the runtime startup, as the container initializes its application, loads configurations, and prepares for traffic. Finally, health probes—liveness and readiness checks—verify that the application is not only running but also capable of handling requests. A platform might check the build status, encounter a temporary network hiccup, and declare the build a failure, even as the Kaniko job continues in the background, successfully pushing the image to the registry.”
- This paragraph is well-written. The structure is clear, moving from the general concept to a step-by-step description of the deployment process. The technical terms (“eventual consistency,” “Kaniko,” “node affinity,” “liveness and readiness checks”) are used correctly. No grammatical errors found.
- Second Paragraph: “This timing disparity creates a window of ambiguity where a deployment platform, with its rigid checking intervals, misinterprets the natural, asynchronous operations of Kubernetes as a catastrophic failure. For example, a platform might poll for the build job’s completion status at the 60-second mark, receive a timeout error, and immediately flag the entire deployment as failed. Meanwhile, the Kaniko build job, unconcerned with the platform’s premature conclusion, successfully finishes its work at the 90-second mark and pushes the finalized container image to the registry. The Kubernetes deployment controller then pulls this new image, and the application pod is up and serving traffic by the 110-second mark. From the cluster’s perspective, everything worked perfectly, albeit with minor delays. The platform, however, remains stuck on its initial assessment, its dashboard glowing red while the application serves production traffic without a problem. This scenario highlights a critical insight: the platform’s user interface is not the ultimate source of truth. True verification requires looking past the dashboard and directly querying the state of the Kubernetes cluster itself to understand what has actually transpired.”
- This paragraph effectively illustrates the point with a concrete example. The language is clear. Grammar and punctuation seem correct. “albeit” is used correctly. “looking past the dashboard” is a good turn of phrase. I see no errors.
**Section 3: `## 2.An investigation into deployment failures ultimately revealed that most alerts originating from platforms were not indicative of actual application or build failures but were, in fact, snapshots of a system in a transient state, captured before Kubernetes had the opportunity to complete its asynchronous, self-healing processes. By learning to interpret Kubernetes events and query the cluster directly, teams transformed what were once mysterious red dashboards into predictable, explainable system behaviors. This shift in methodology eliminated countless hours of wasted debugging on functional code, significantly reduced the frequency of unnecessary escalations to senior engineers, and fostered greater confidence in the underlying deployment systems. The next time a platform reported a failure, the first step was no longer to scrutinize code but to check the cluster. More often than not, the pods were already running perfectly, patiently waiting for someone to verify their true status.